Figures & data
Table 1. Summary statistics by allergy testing type.
Table 2. Unadjusted health utilization and outcomes at baseline and 1-year post index testing, by allergy testing patterns.
Figure 1. Health care utilization and outcomes 0-12 months post index allergy testing, per patient by testing pattern. (a) Prescriptions, (b) Visits.
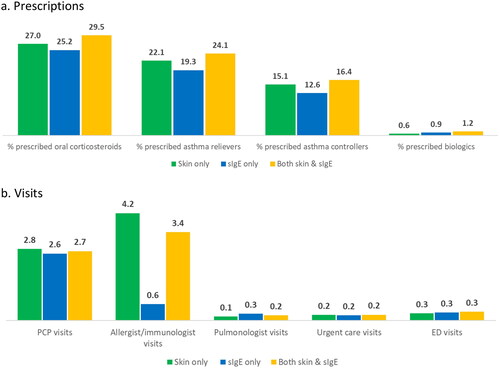
Table 3. Multivariable linear regression results on the associations between allergy testing patterns and subsequent health utilization and outcomes.
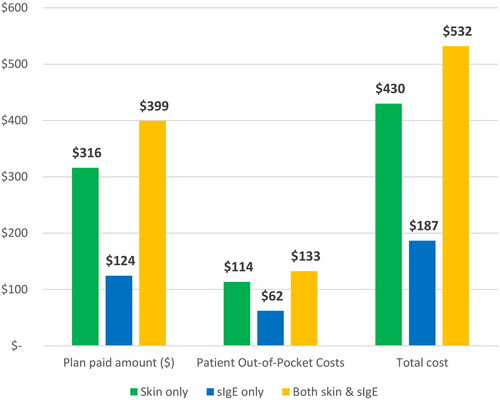
Figure 2. Average cost of allergy testing per patient by testing pattern.