
Figures & data
Table 1. Demographic and baseline characteristics.
Table 2. Time-related variables.
Figure 1. Boxplot of the estimated conditional probability of receiving treatment between the treatment arm and the external comparator arm. The PS overlapped for 81.6% of the total patients included in the analysis. The edges of the box indicate the IQR, values between Q1 and Q3. The diamond indicates the mean, the line inside the box indicates the median. The whiskers represent the minimum and maximum observations within a range from Q1 − 1.5*IQR to Q3 + 1.5*IQR.
Study RS002: estimated conditional probability of being treated: mean = 0.241; median = 0.221; IQR = 0.119, 0.340; minimum, maximum = 0.023, 0.639.
ALLELE: estimated conditional probability of being treated: mean = 0.383; median = 0.369; IQR = 0.271, 0.504; minimum, maximum = 0.117, 0.697.
IQR, Interquartile range; PS, Performance score; Q, Quartile.
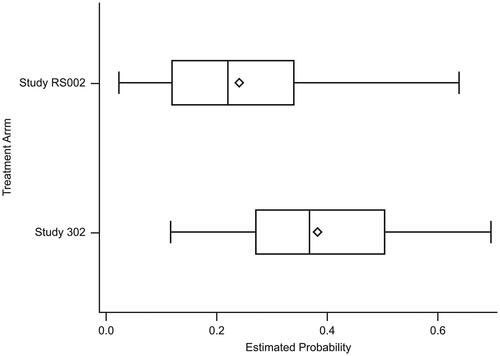
Table 3. Comparison of baseline covariates before and after weighting.
Figure 2. Kaplan-Meier survival estimates between the treatment arm and the external comparator arm (unadjusted). Patients who received tabelecleucel had significantly longer overall survival than patients who received current treatment. The index date is defined as the date of the first dose of tabelecleucel in ALLELE and the date of the next line of systemic therapy in RS002.
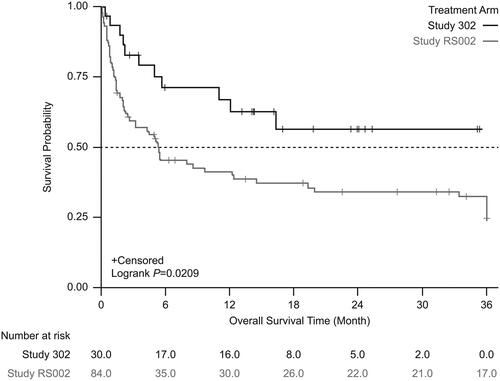
Figure 3. Kaplan-Meier survival estimates between the treatment arm and the external comparator arm (adjusted: standardized mortality ratio weighting). Patients who received tabelecleucel had significantly longer overall survival than patients who received current treatment. The index date is defined as the date of the first dose of tabelecleucel in ALLELE and the date of the next line of systemic therapy in RS002.
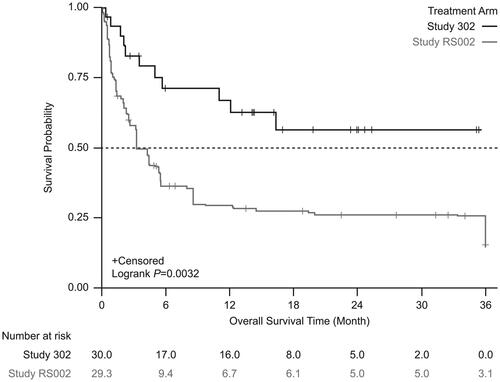
Table 4. OS between the treatment arm and the external comparator arm.
Figure 4. Kaplan-Meier survival estimates between the treatment arm and the external comparator arm (unadjusted). Patients who received tabelecleucel had significantly longer overall survival than patients who received current treatment. The index date is defined as the date of the first dose of tabelecleucel in ALLELE and the date that disease was relapsed/refractory to rituximab ± chemotherapy in RS002.
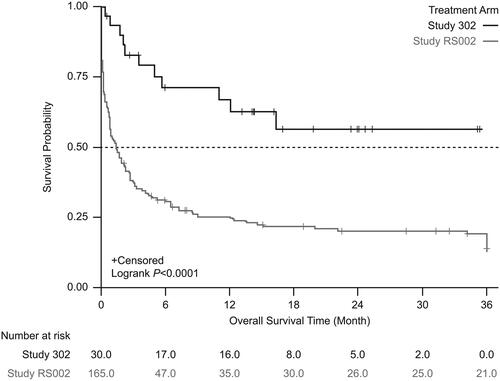
Figure 5. Kaplan-Meier survival estimates between the treatment arm and the external comparator arm (adjusted: standardized mortality ratio weighting). Patients who received tabelecleucel had significantly longer overall survival than patients who received current treatment. The index date is defined as the date of the first dose of tabelecleucel in ALLELE and the date that disease was relapsed/refractory to rituximab ± chemotherapy in RS002.
