
Figures & data
Table 1. Inclusion and exclusion criteria.
Table 2. Data extracted from selected studies.
Figure 1. PRISMA diagram. Abbreviations: FT, full text; PRISMA, Preferred Reporting Items for Systematic Reviews and Meta-Analyses; pVO2, peak oxygen consumption.
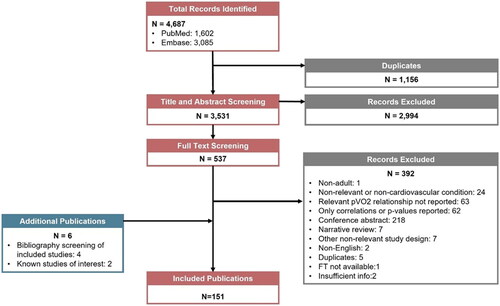
Table 3. HCM study characteristics.
Table 4. pVO2 as a predictor of single and composite endpoints.
Supplemental material