
Figures & data
Table 1. Population attributable fractions applied for HPV-related cancers.
Table 2. Parameter assumptions made in the model.
Table 3. Number of cancer deaths related to HPV, by cancer type and by sex, in 2019.
Table 4. YLL and YPLL related to HPV, by cancer type and by sex, in 2019.
Table 5. PVFLP related to HPV by cancer type across UK countries in 2019.
Figure 1. YLL per death related to HPV by cancer type in each UK country. There was a lack of data reporting for less prevalent cancers (penis, anus, vagina, vulva) in Northern Ireland. The number of cancer deaths attributable to HPV infection were estimated by applying population attributable fractions for each anatomic location to mortality inputs. Abbreviations: HPV, Human papillomavirus; YLL, Years of life lost.
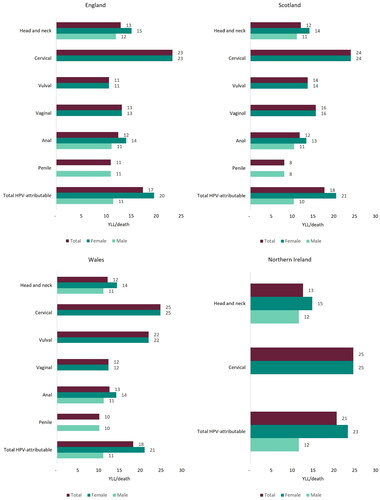
Table 6. PVFLP related to HPV by cancer type and by sex in the UK in 2019.
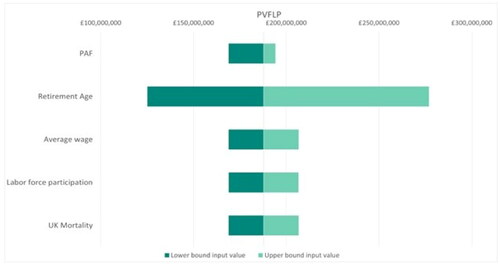
Figure 2. Tornado diagram for PVFLP in 2019. Abbreviations: PAF, Population attributable fraction; PVFLP, Present value of future lost productivity; UK, United Kingdom.
Supplemental Material
Download MS Word (47.8 KB)Data availability statement
The authors confirm that the data supporting the findings of this study are available within the article and its supplementary materials where links are available to the publicly available datasets used.