Figures & data
Figure 1. Underlying model structure. BMI, body mass index; CKD, chronic kidney disease; CVD, cardiovascular disease; eGFR, estimated glomerular filtration rate; ESKD, end stage kidney disease; HbA1c, glycated haemoglobin; HF, heart failure; KDIGO, kidney disease: improving global outcomes; PAD, peripheral arterial disease; uACR, urine albumin-creatinine ratio; TIA, transient ischaemic stroke.
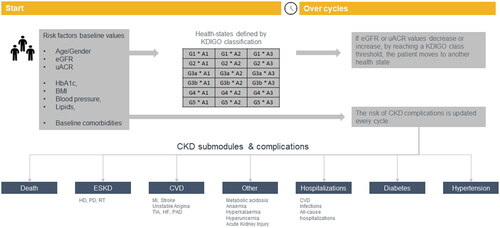
Table 1. Annual absolute changes in eGFR based on KDIGO categories used in the model.
Table 2. Annual fold change in uACR based on KDIGO categories used in the model.
Table 3. Treatment effects on other risk-factors used in the model.
Table 4. Summary of the cost inputs used in the model.
Table 5. Cost estimation for SoC.
Table 6. 1-Year transition probabilities across KRT modalities or death.
Table 7. Summary of the cost-utility analysis results.
Table 8. Average risk of CV and renal outcomes for empagliflozin (plus SoC) versus SoC alone over the modelled time horizon.
Table 9. Model outcomes based on T2DM status.
Table 10. Model outcomes for patients with normo- or microalbuminuria.
Figure 2. One-way sensitivity analysis results – Malaysia. The horizontal axis is the Net Monetary Benefit (NMB) in Malaysian Ringgit (MYR); 1 USD = 4.66 MYR. A positive NMB indicates a cost-effective result (considering a willingness-to-pay threshold of MYR 52,689 (USD 11,307))
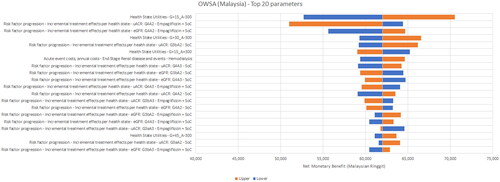
Figure 3. One-way sensitivity analysis results – Thailand. The horizontal axis is the Net Monetary Benefit (NMB) in Thai Baht (THB); 1 USD = 35.28 THB. A positive NMB indicates a cost-effective result (considering a willingness-to-pay threshold of THB 160,000 (USD 4,535))
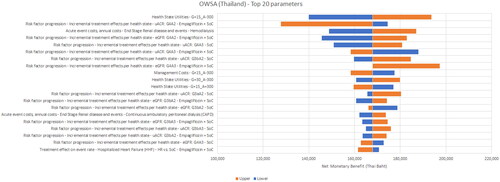
Figure 4. One-way sensitivity analysis results – Vietnam. The horizontal axis is the Net Monetary Benefit (NMB) in Vietnamese Dong (VND); 1 USD = 24,224 VND. A positive NMB indicates a cost-effective result (considering a willingness-to-pay threshold of VND 96,890,026 (USD 4,000))
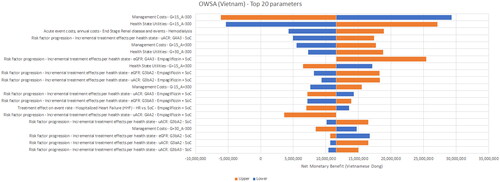
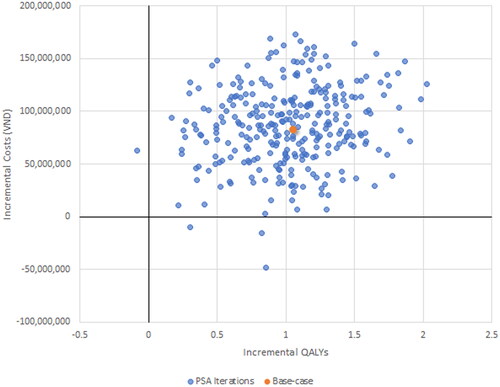
Figure 5. Probabilistic sensitivity analysis plot for Malaysia.
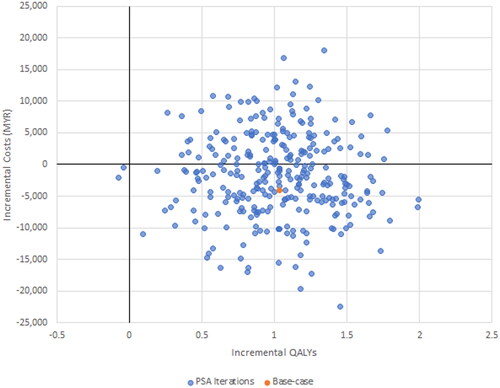
Figure 6. Probabilistic sensitivity analysis plot for Thailand.
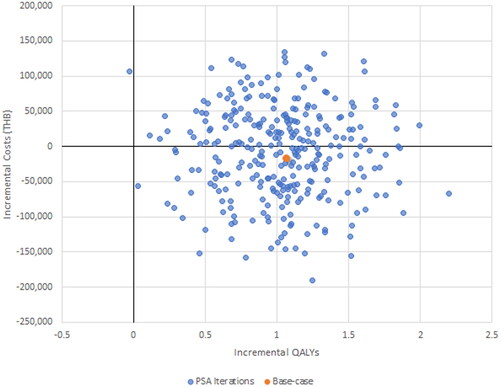
Figure 7. Probabilistic sensitivity analysis plot for Vietnam.