
Figures & data
Table 1. Resource consumption real-world analysis: baseline characteristics of the cohort.
Table 2. Resource consumption real-world analysis: procedural time and healthcare professional workload by phase and treatment option.
Table 3. Total costs for a cohort of 100 patients
Figure 1. Decision tree structure for the cost-consequence analysis
*Includes costs on procedural time, administered drugs, exams, and length of stay.
CRYO, cryoablation; PFA, pulsed field ablation; RFA, radiofrequency ablation.
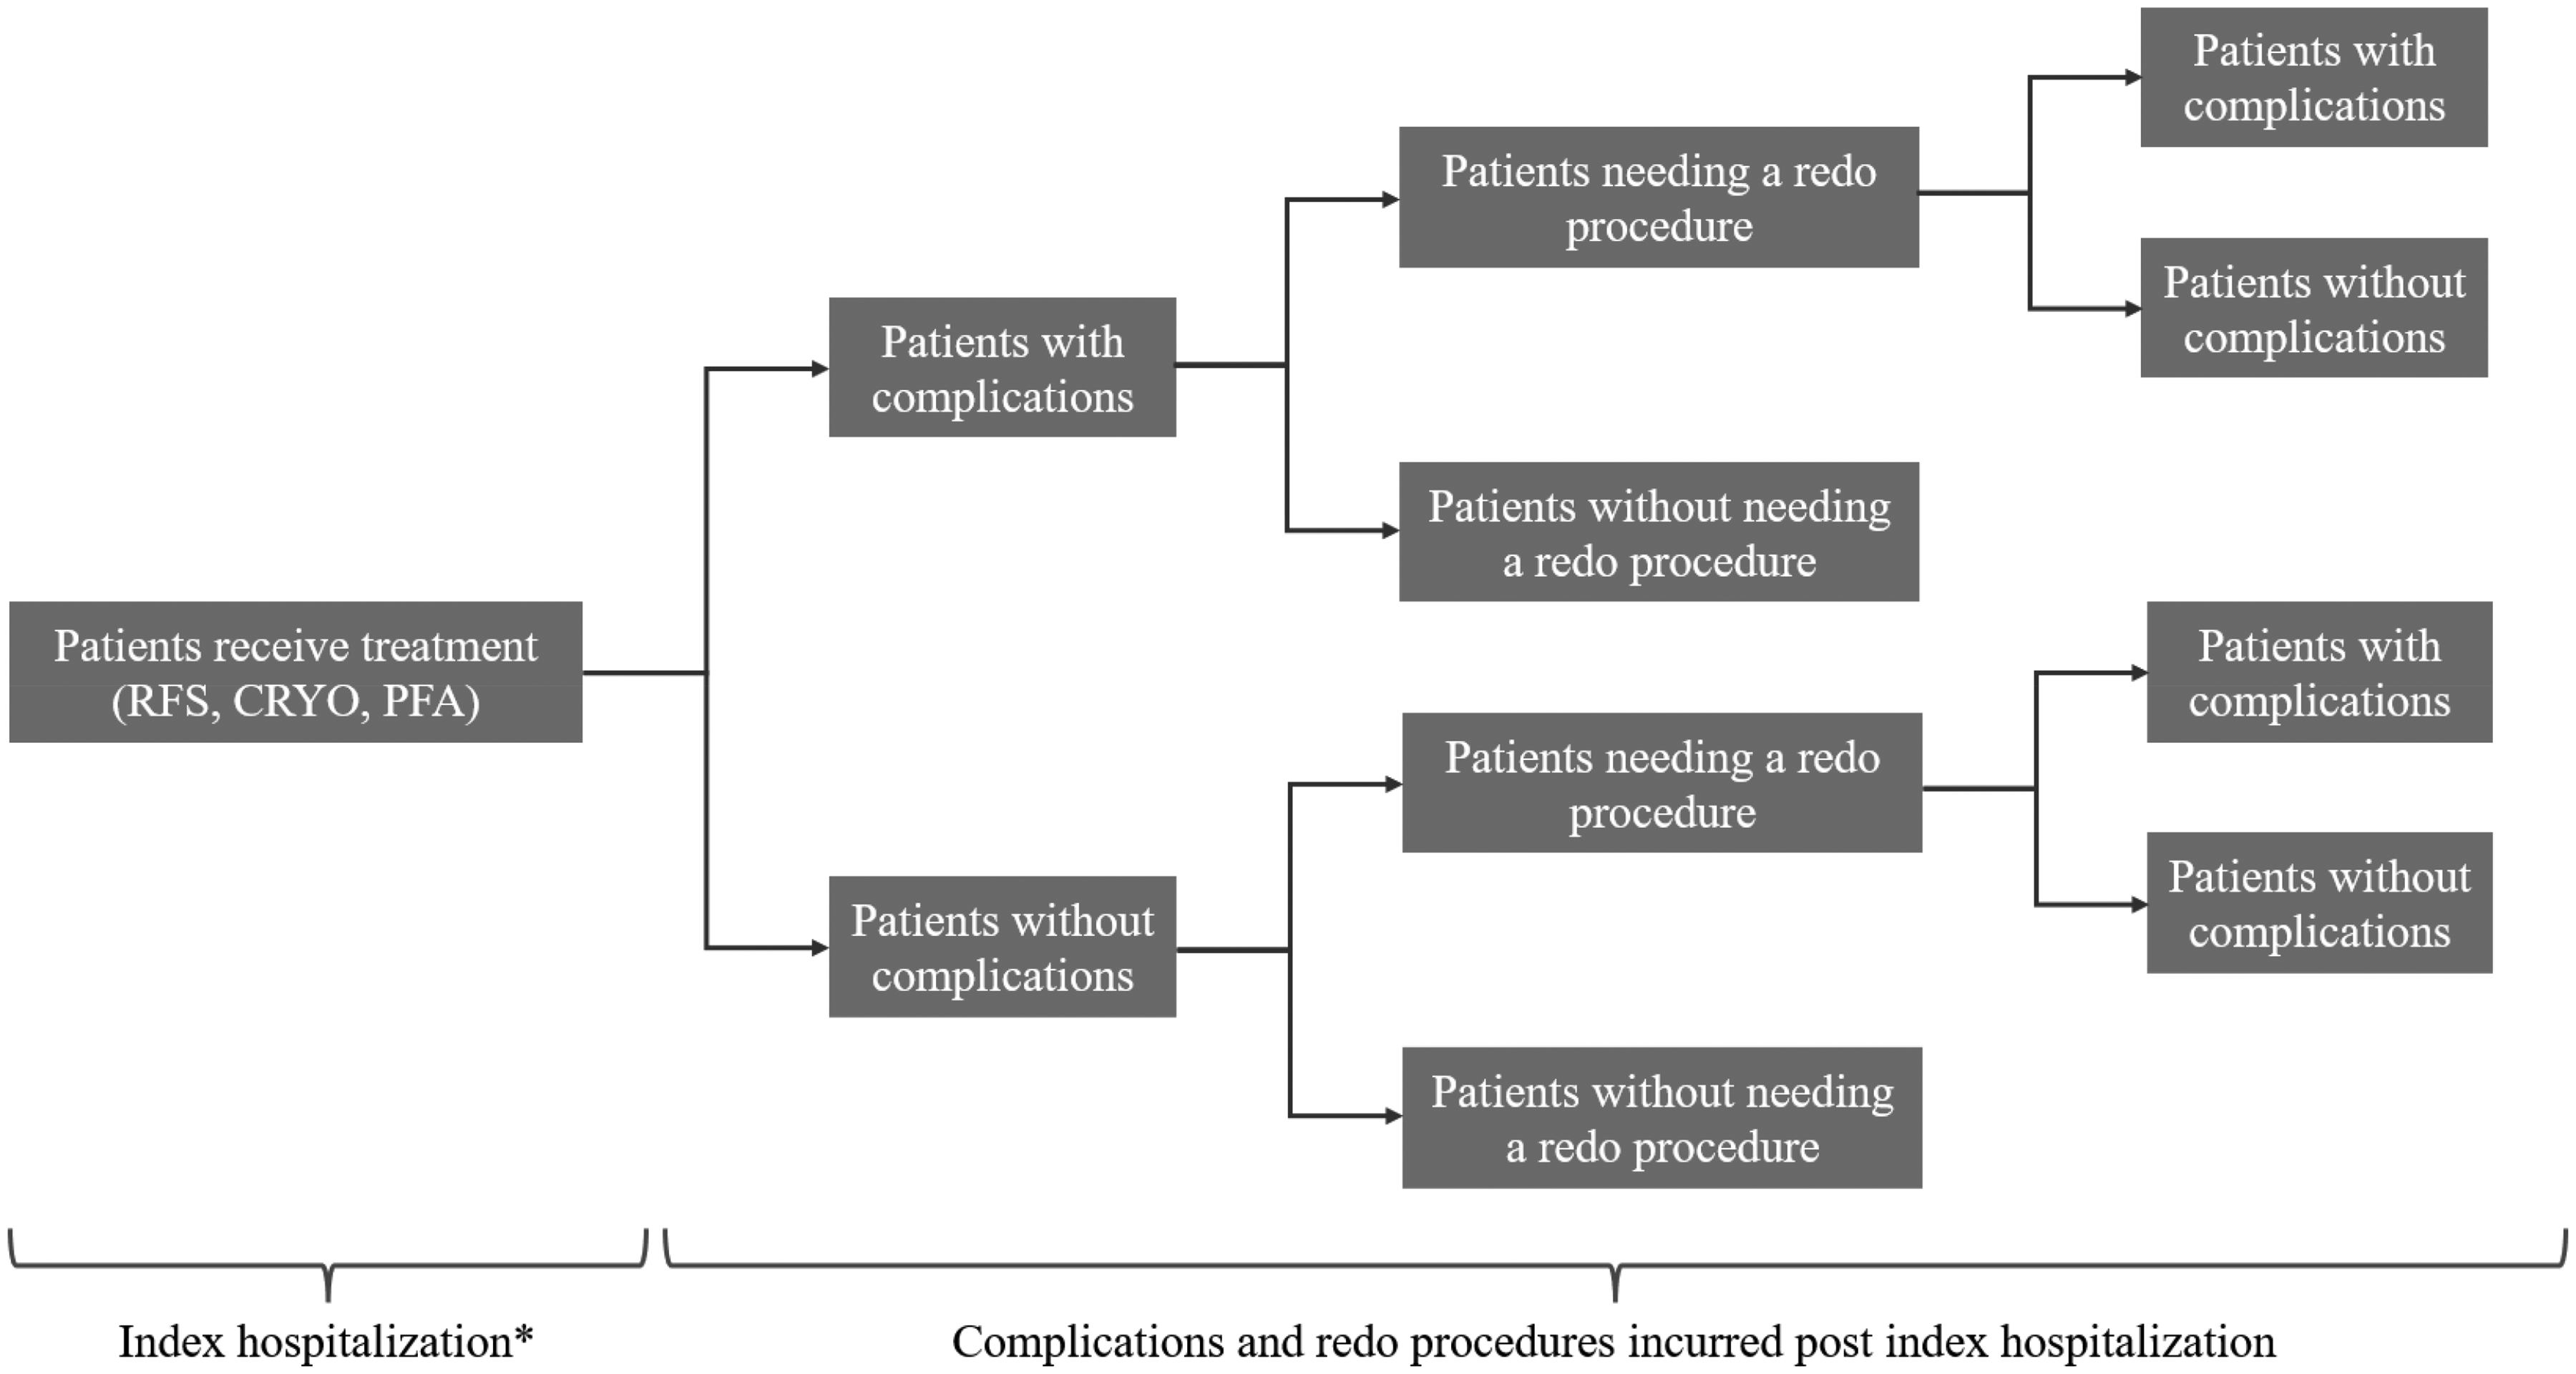
Figure 2. Total cost per patient of the cardiac ablation procedure by treatment option
CRYO, cryoablation; PFA, pulsed field ablation; RFA, radiofrequency ablation.
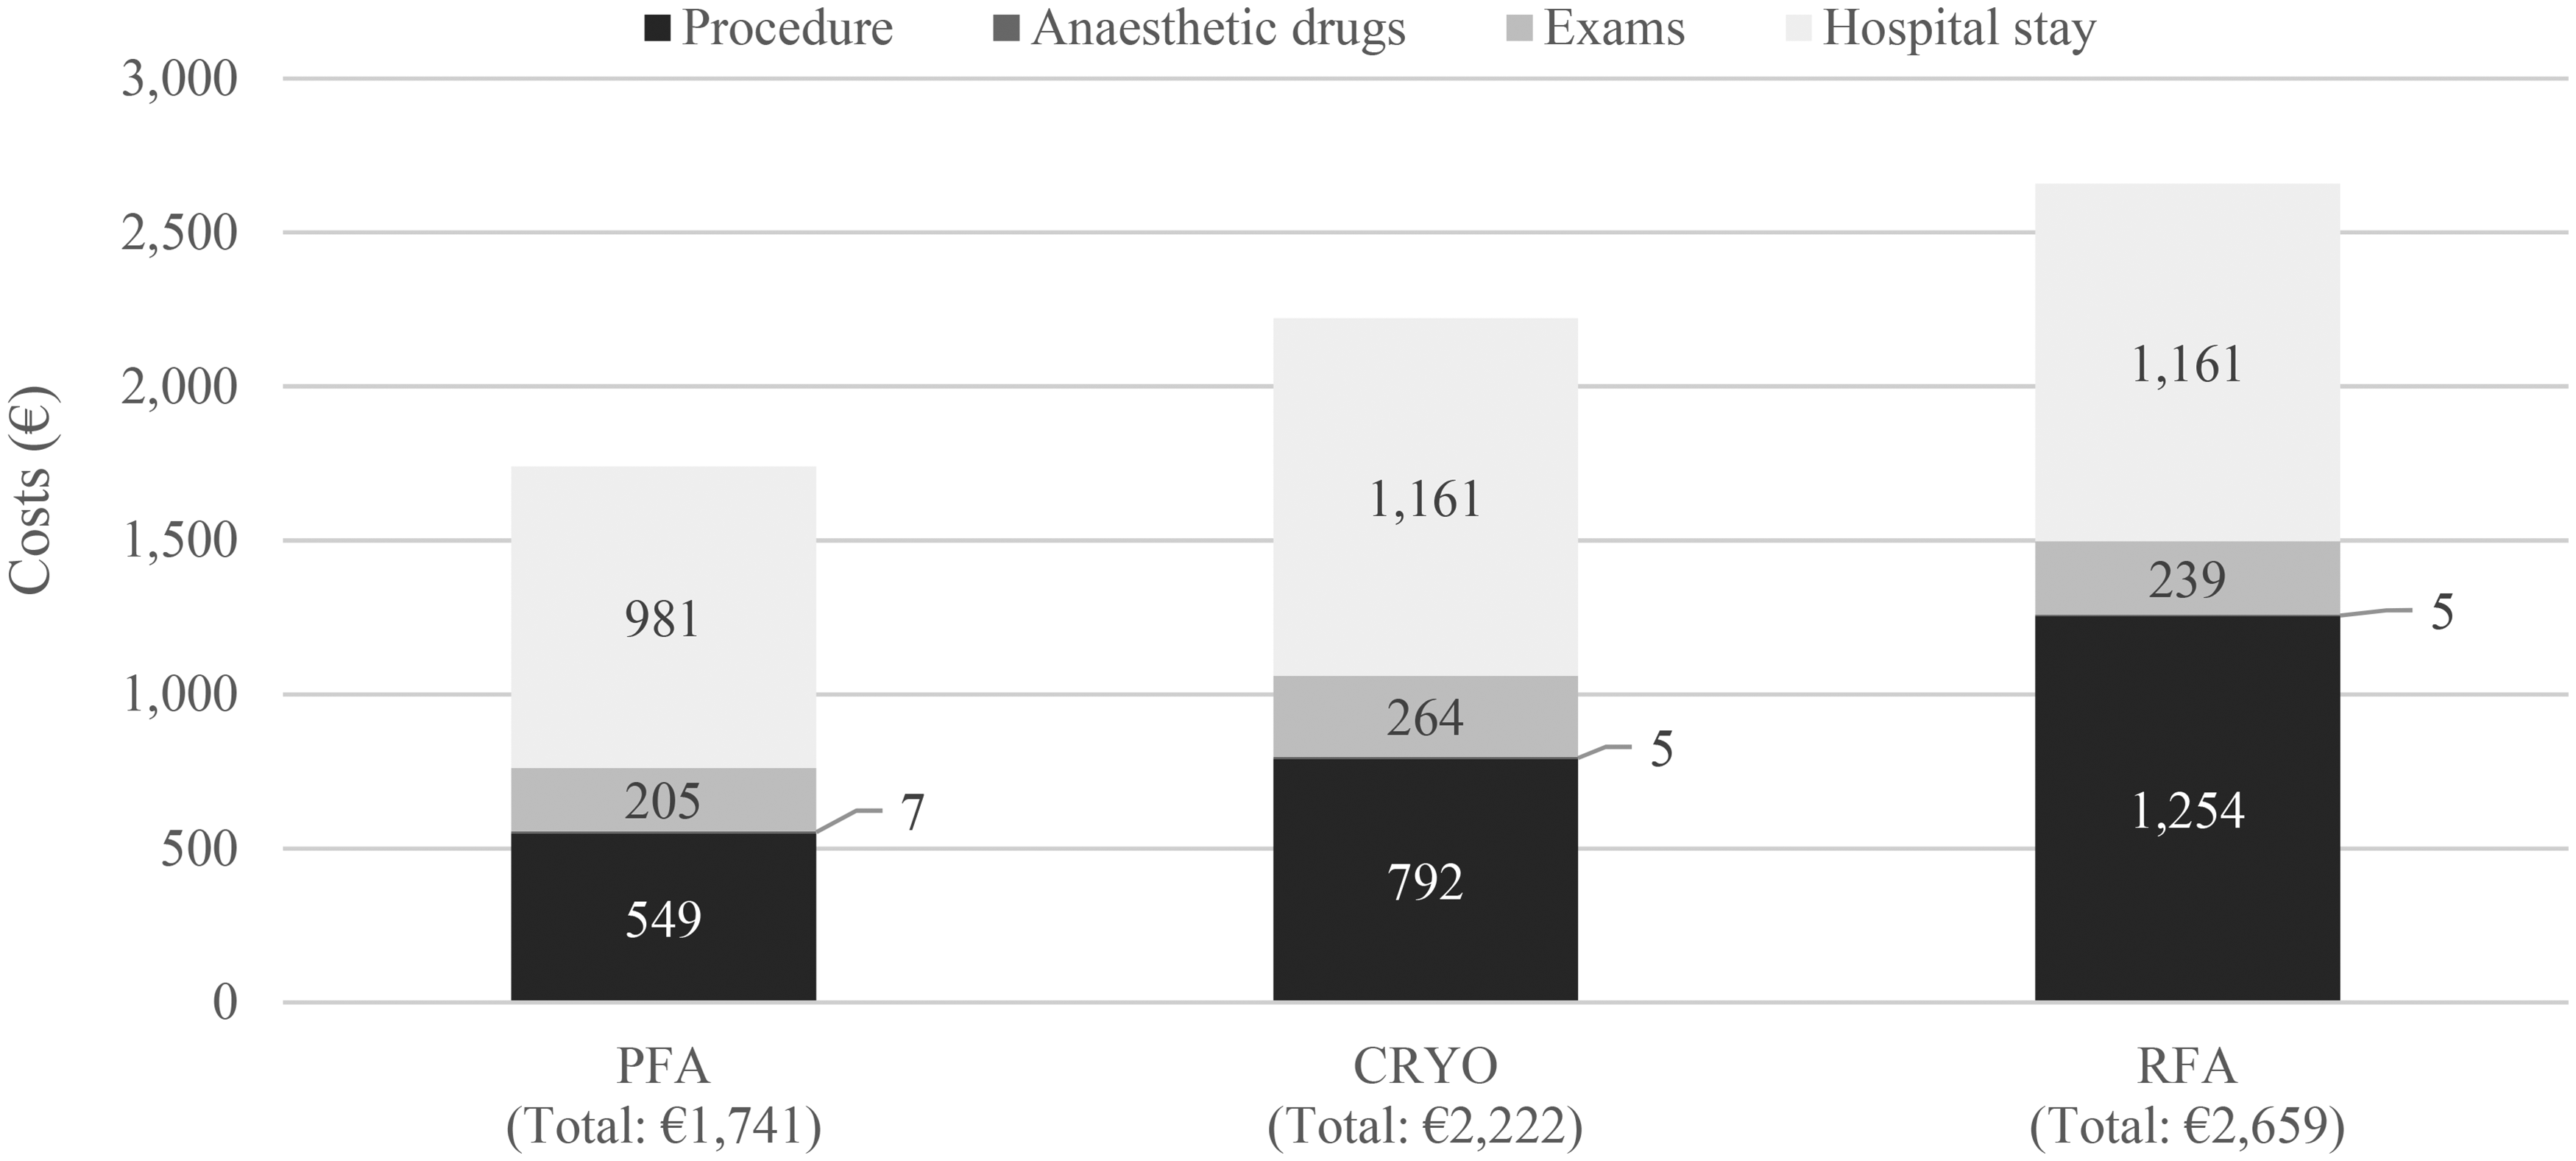
Figure 3. Boxplot of total cost per patient. Each box represents the interquartile range of the total patient cost. The median value is indicated by the line inside each box, with whiskers extending above and below the box. Outliers are shown as individual points
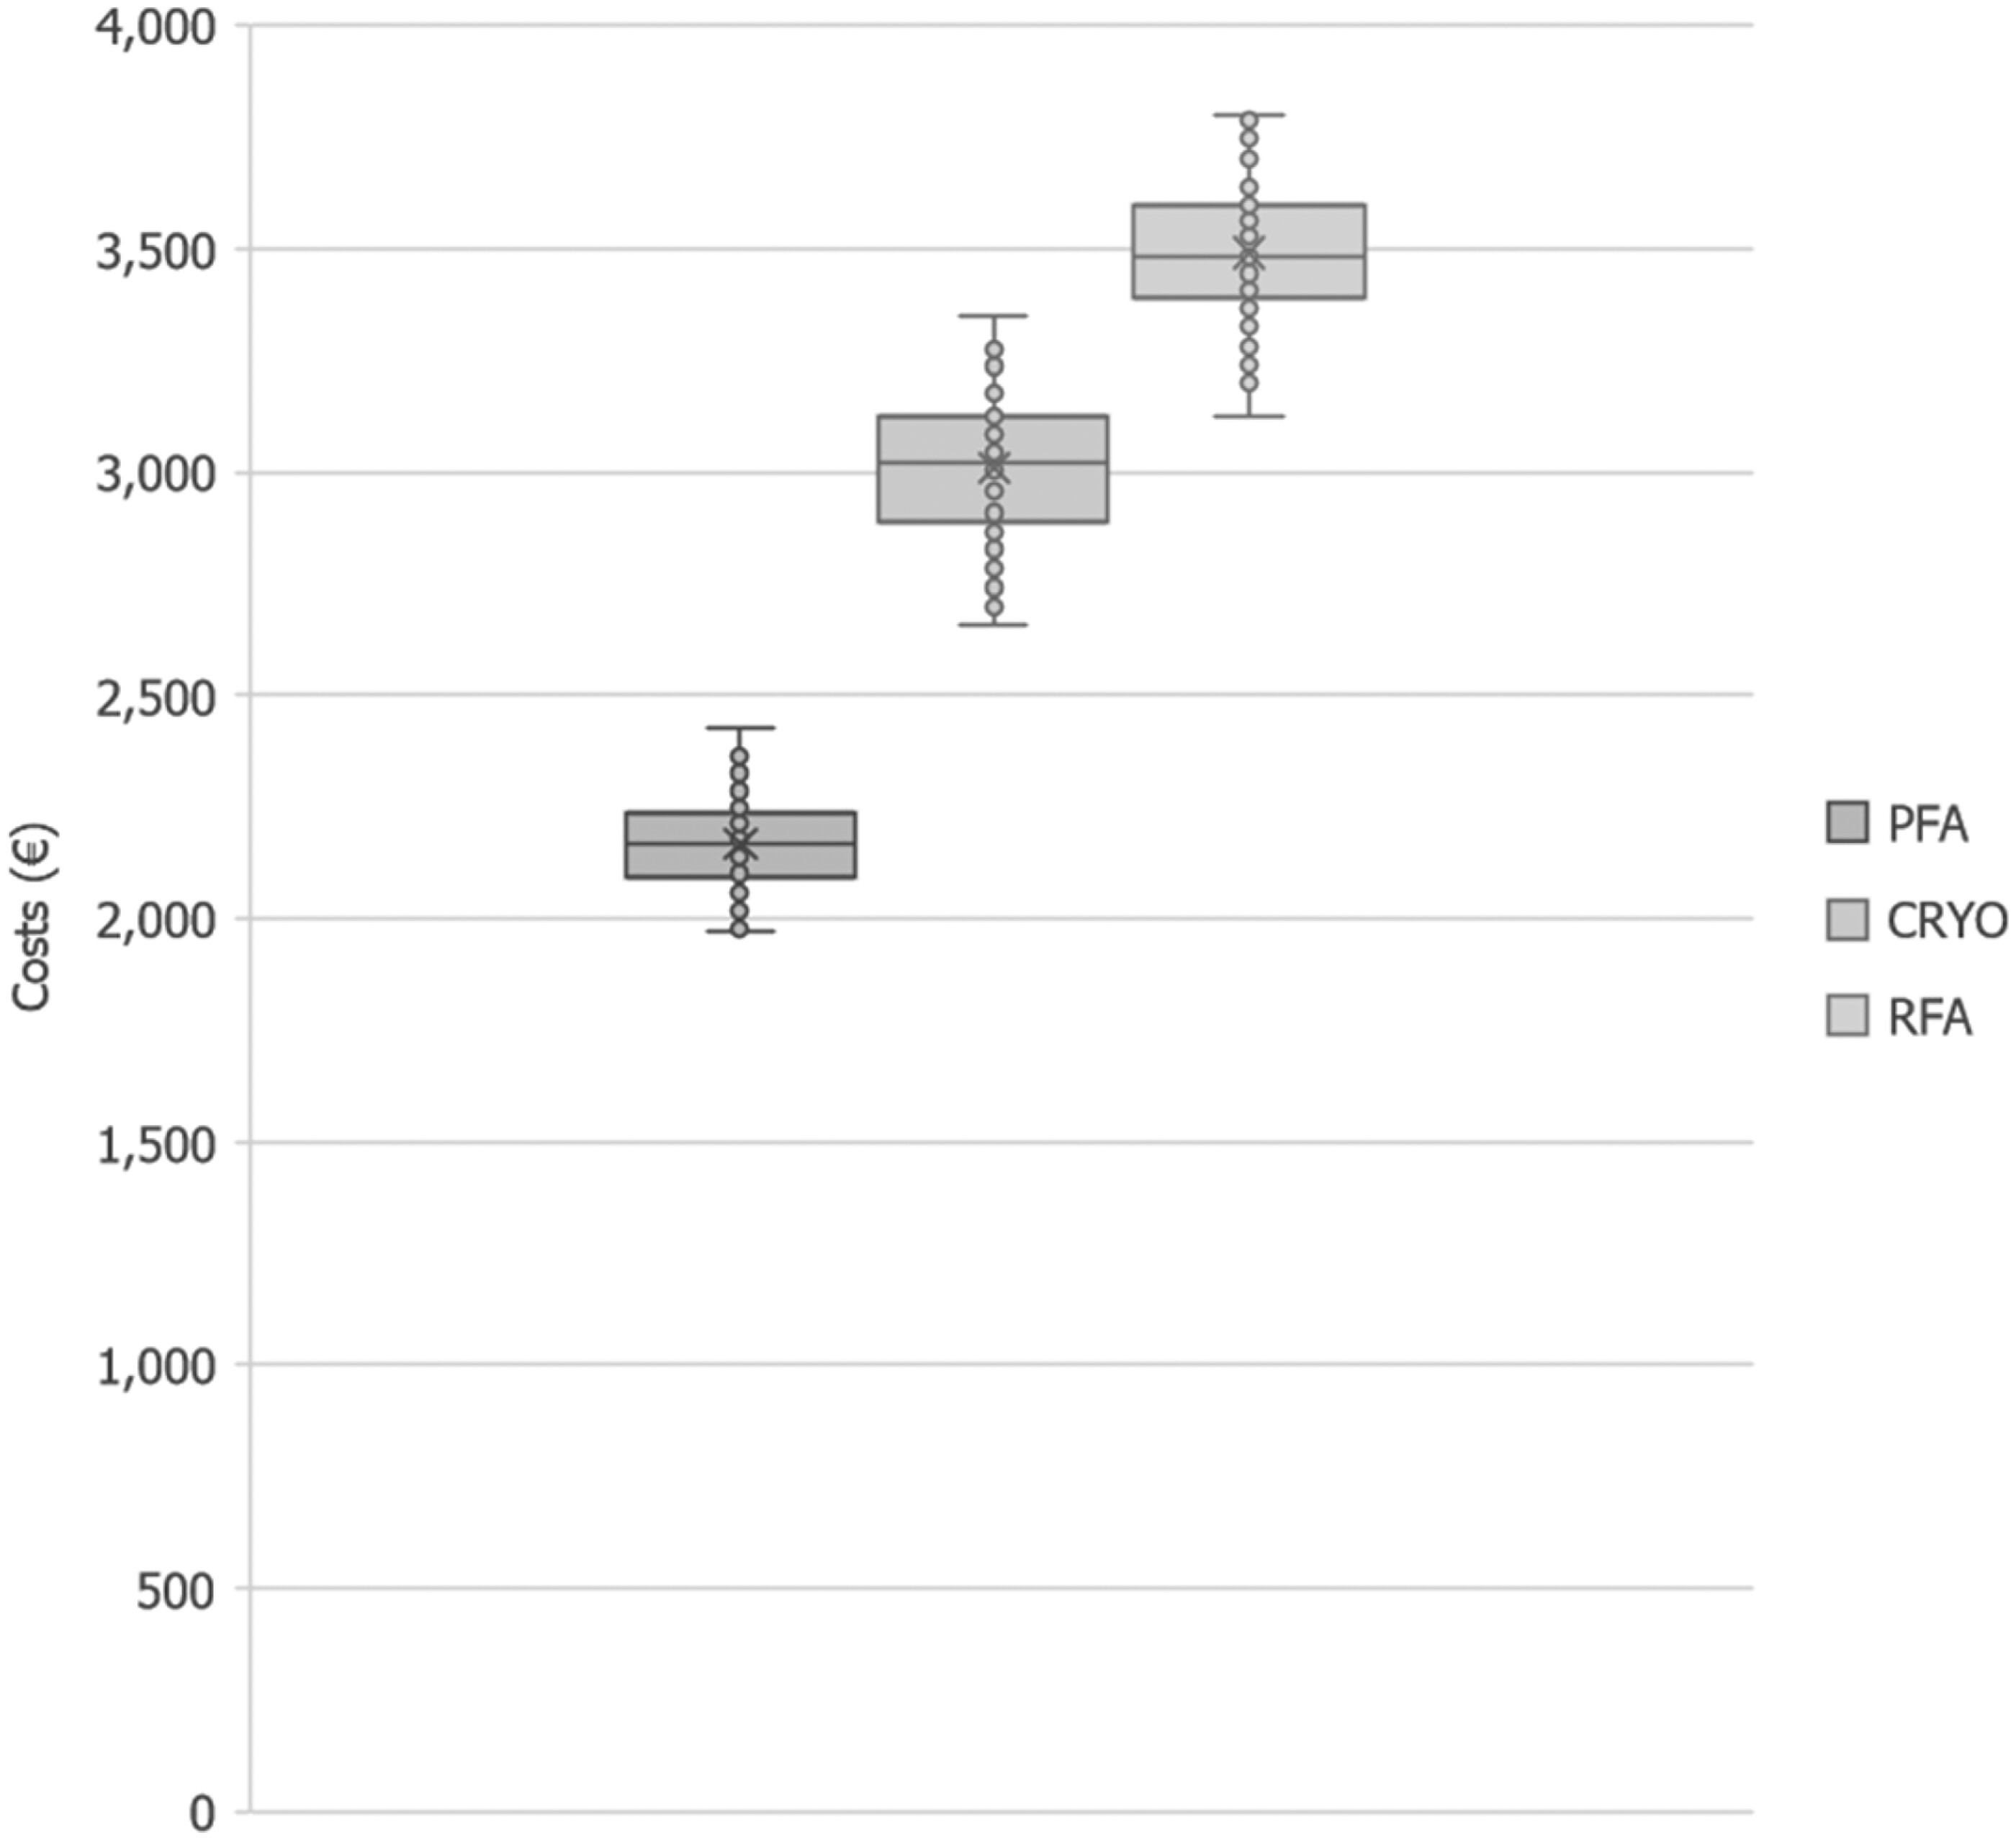
Figure 4. Scenario analysis: total cost difference vs. possible price differences between PFA vs. CRYO and RFA kit
CRYO, cryoablation; PFA, pulsed field ablation; RFA, radiofrequency ablation.
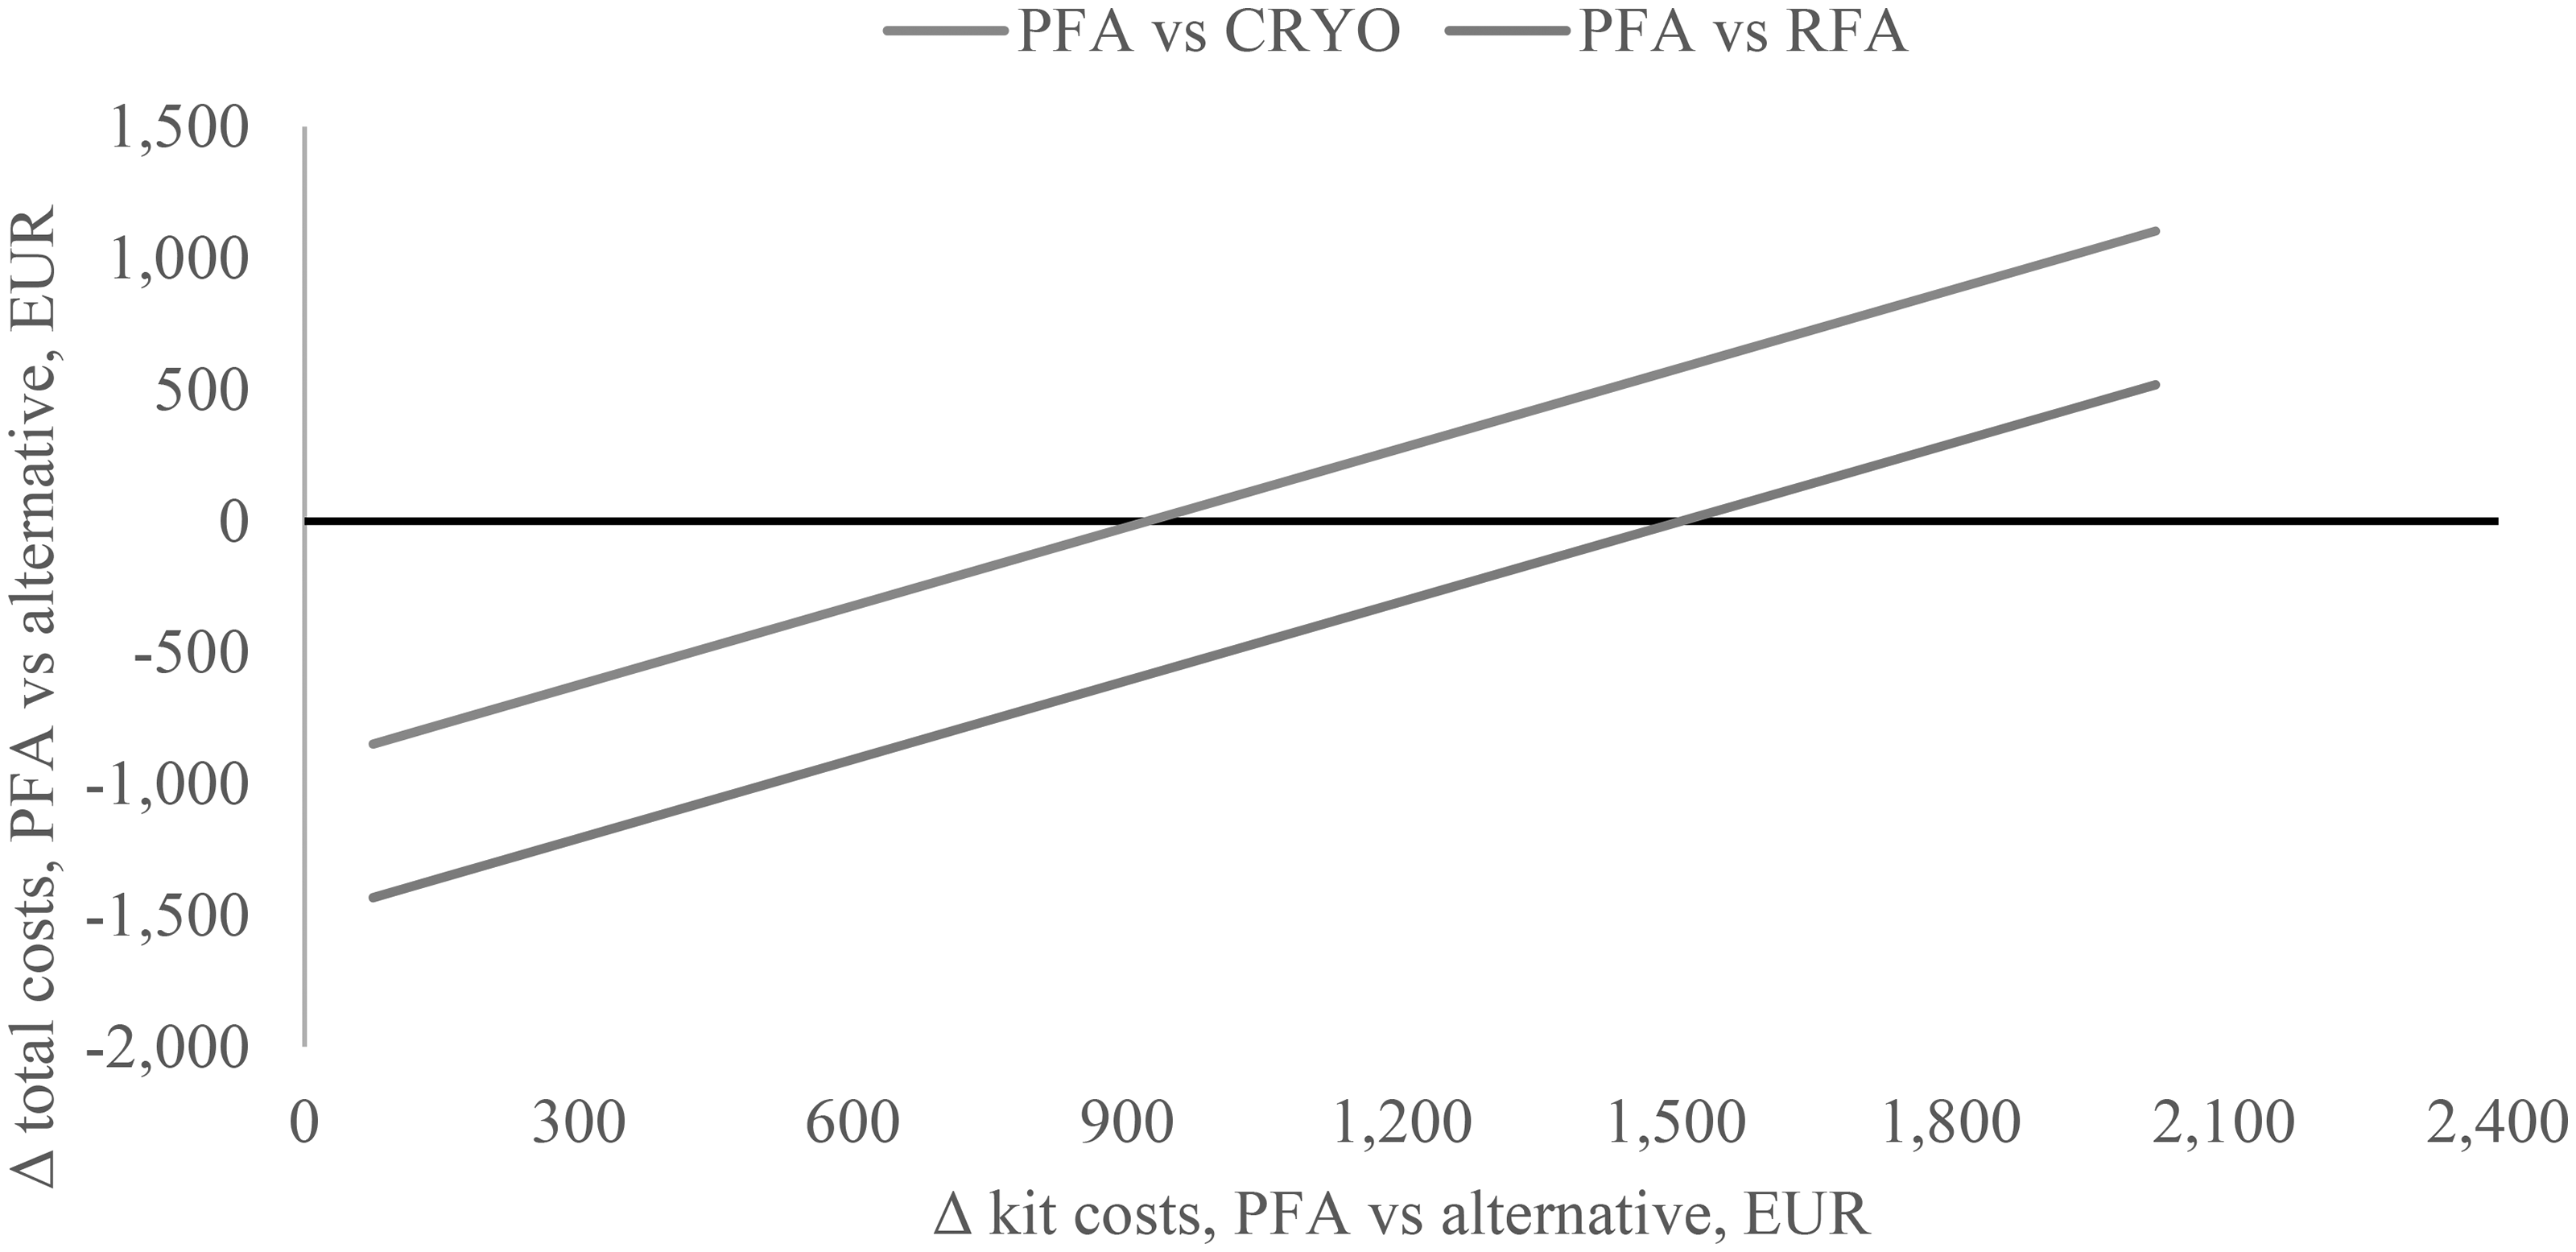
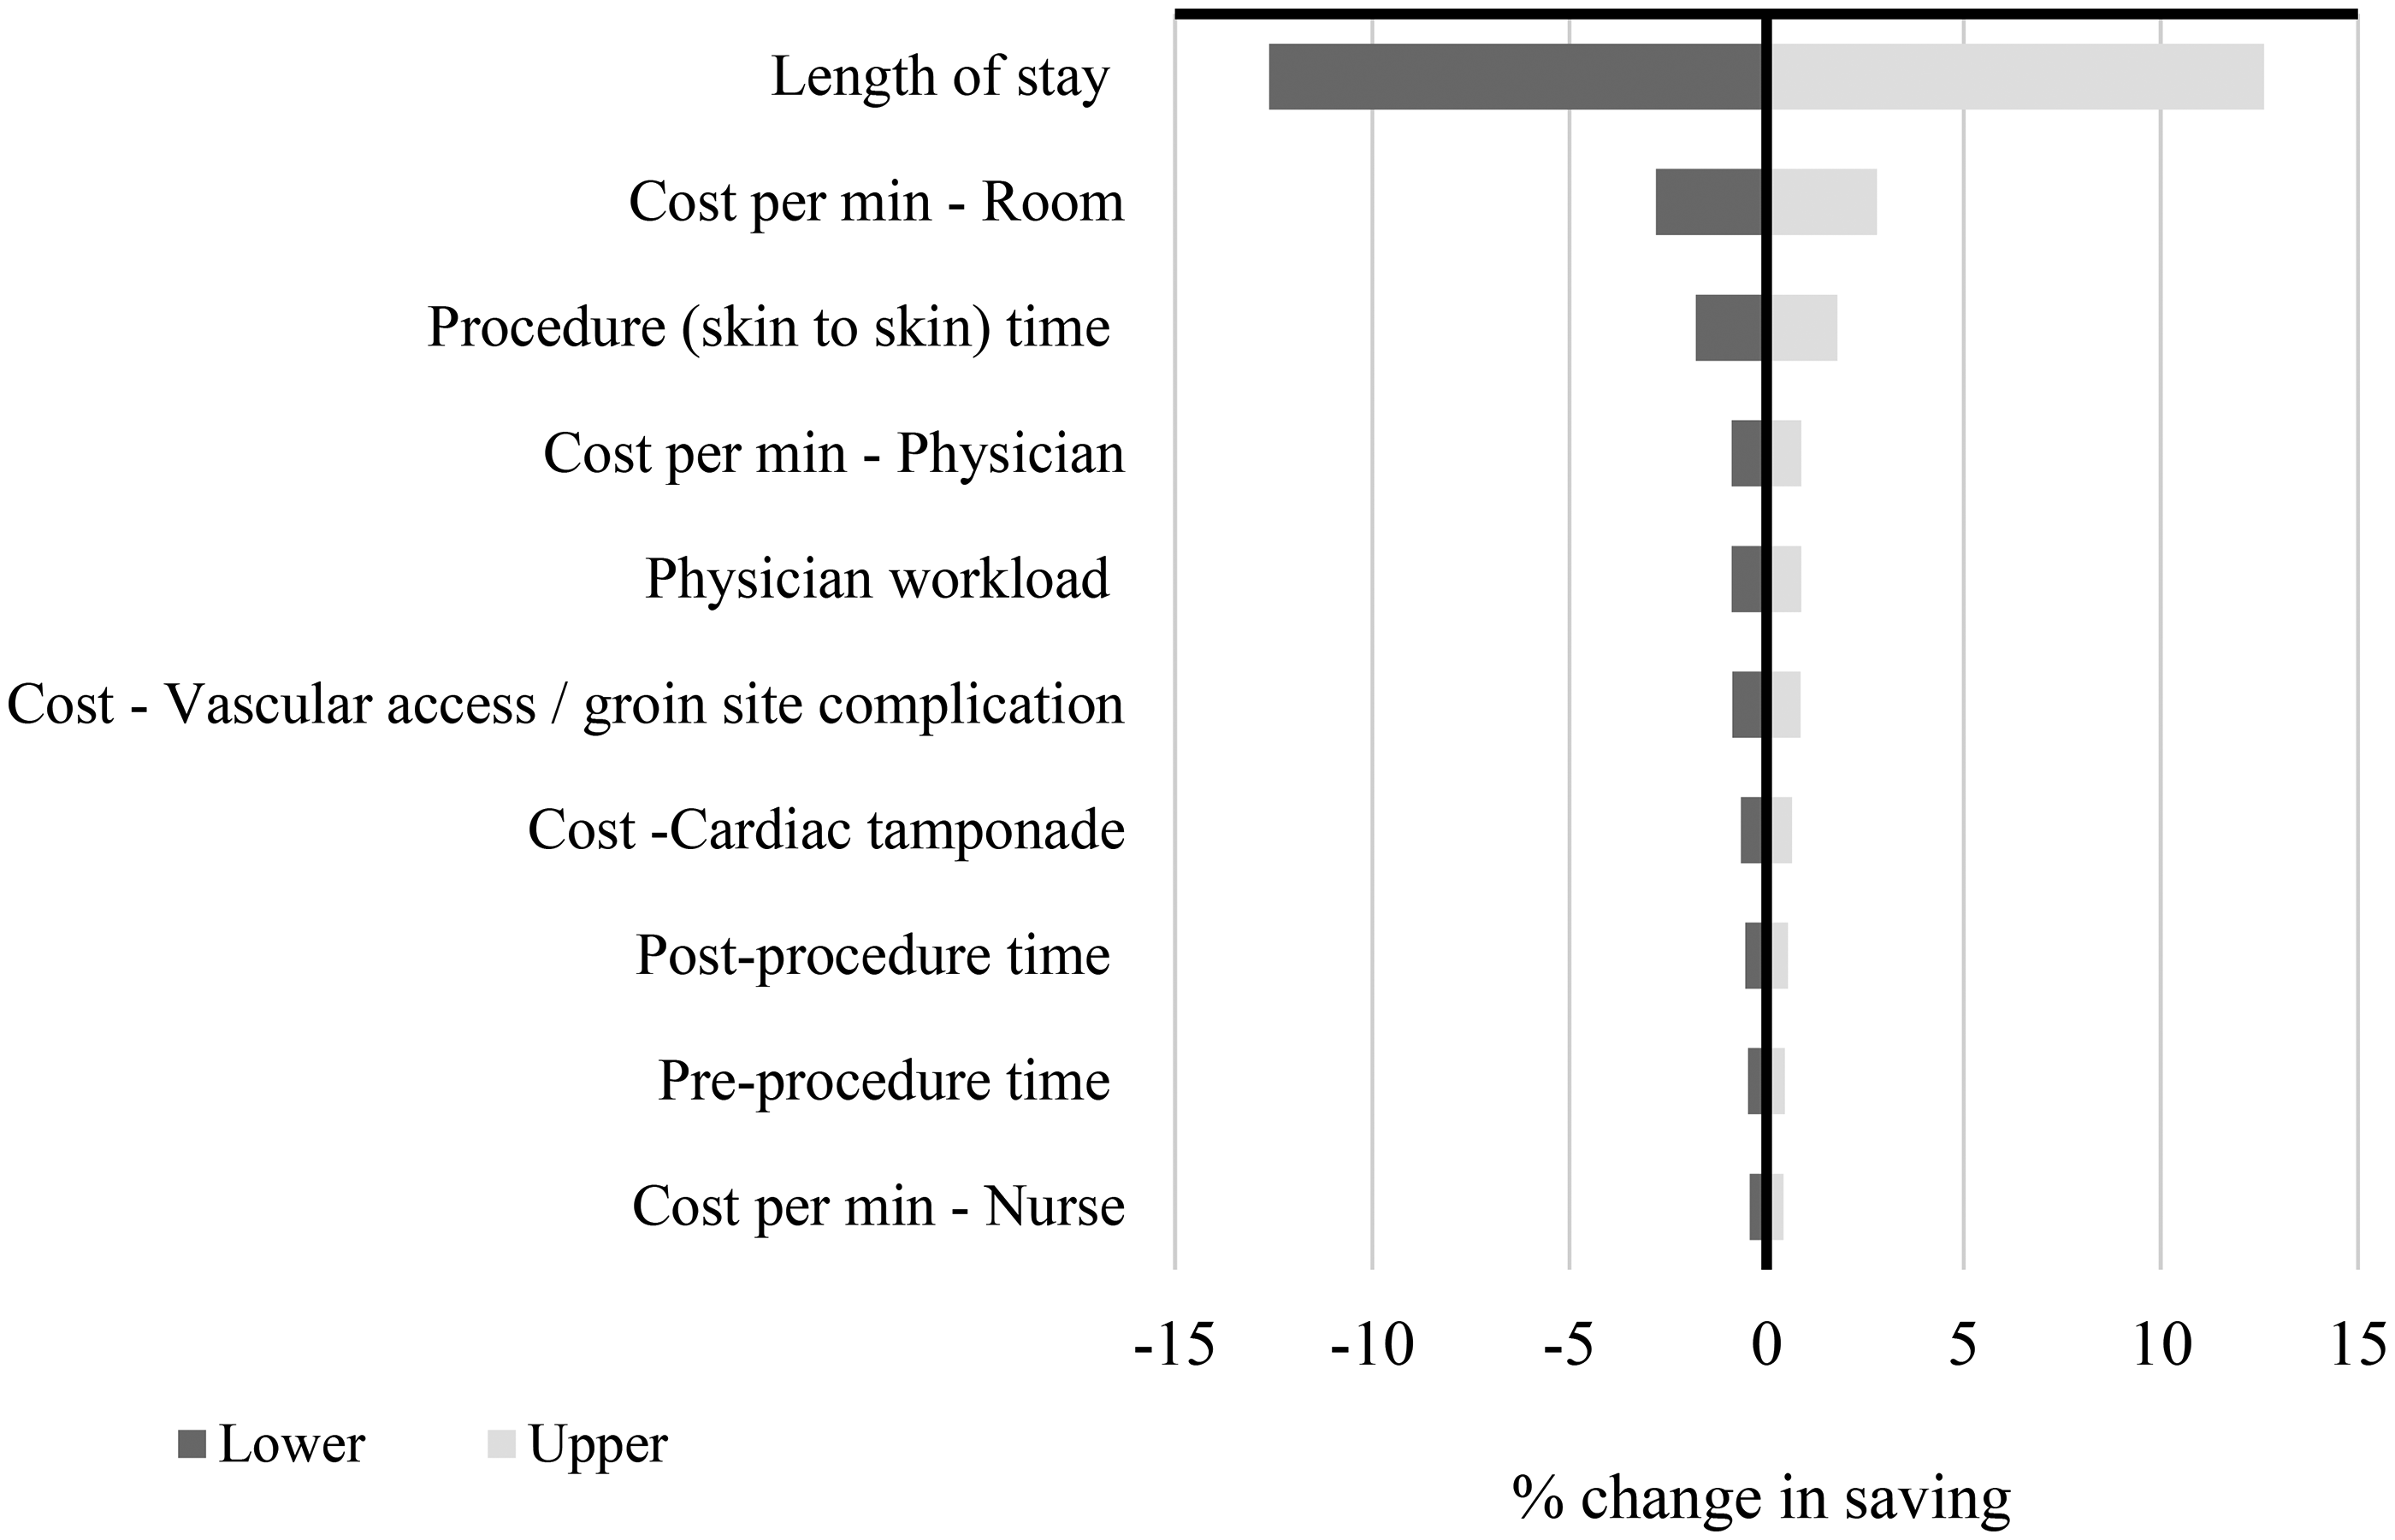
Figure 5. Tornado plot showing results of the one-way sensitivity analysis