Figures & data
Table 1. Literature overview. Studies that assessed spatial working memory (SWM) performance in patients with visuospatial neglect (VSN) directly. The total number of participants are split by patients with visuospatial neglect (VSN+), patients without visuospatial neglect (VSN-) and healthy control subjects. In the rightmost column a brief description of the SWM task is provided.
Table 2. Demographics.
Figure 1. Trial sequence. Participants had to indicate whether Target 2 (yellow) was presented above or below the location of Target 1 (red). The distance between the locations of Target 1 and Target 2 was controlled by a staircase procedure, i.e. the distance was made smaller when the response on the previous trial was correct, and vice versa. In the delay between Target 1 and Target 2, the fixation point briefly expanded and contracted. Responses were given verbally and entered through a standard keyboard by the experimenter. Actual background color was grey, here depicted as white.
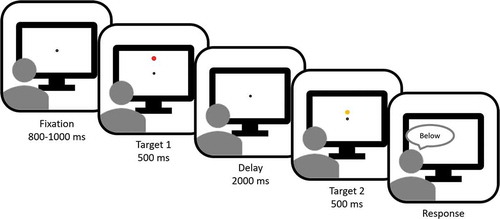
Table 3. Proposed interpretation of Bayes factors.
Figure 2. Spatial working memory (SWM) thresholds. For the boxplots, the central horizontal lines indicate the median threshold per group. Boxes encompass the inter-quartile range, whiskers extend to 2.5th and 97.5th quantiles of the group data. Points are participant with scores outside these intervals. (a) Thresholds per group. There was strong evidence in favor of an effect of group on the SWM thresholds (BF10 = 3.12 × 10¹⁴). Moreover, the medians per group are different of the medians of the other groups, as indicated by non-overlapping 95% credible intervals. (b) Thresholds per group and split between males and females. There was no clear evidence for an effect of sex on the SWM thresholds (BF10 = 0.374). (c) Thresholds as a function of age. There was inconclusive evidence for an effect of age on the SWM thresholds (BF10 = 0.934). Ellipses represent area that holds 95% of the cases per group. Blue = control, yellow = VSN-, red = VSN+. Black ellipse represents 95% area across all cases.
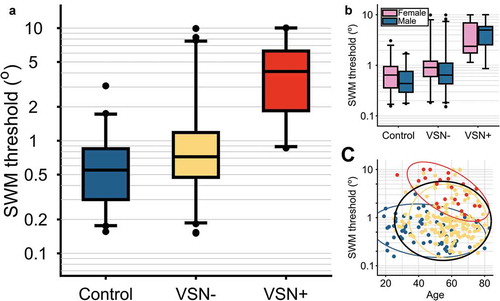
Figure 3. Control analyses. Red represents the VSN+ group. Yellow represents the VSN- group. Note that in these analyses we only included a subset of patients for which we had the data (see ). Spatial working memory (SWM) thresholds as a function of (a) MoCA score (BF10 = 141), (b) SAN score, (Dutch aphasia test; BF10 = 0.397), (c) Motricity Index arm (BF10 = 0.490), and (d) Motricity Index leg (BF10 = 0.530), (e) Barthel index (BF10 = 1.16). When accounting for these relations, the VSN+ group still has a higher median SWM threshold than the VSN- group (BF10 = 3.49 × 10⁴). In sum, across patients, a lower MoCA score is related to a higher SWM threshold and the presence of VSN predicts an additional increase in SWM threshold, but none of the other measures for general disability was strongly related to SWM performance.
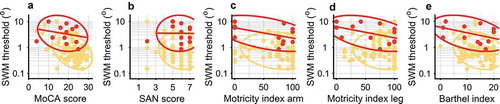
Table 4. Number of patients with a lateralized attention deficit (VSN) and an SWM impairment (SWM), for whom we also had access to the MoCA score.
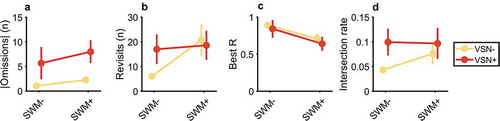
Figure 4. Effect of SWM deficit and VSN on search performance, as assessed with the cancellation task with invisible markings. SWM+ group consists of patients with an SWM threshold > 1.24°. Points represents mean, error bars 1 s.e.m. (a) Absolute difference between the number of omission on the left and right side of the search display. There is strong evidence for an effect of VSN on the number of omissions, but inconclusive evidence for an effect of the SWM deficit. (b) Number of delayed revisits. There is substantial evidence for an effect of the SWM deficit on the number of revisits, but inconclusive evidence for a main effect of VSN, or an interaction effect. (c) Best R. There is strong evidence for an effect of SWM, but inconclusive evidence for an effect of VSN or an interaction effect. (d) Intersection rate. There is inconclusive evidence for an effect of either SWM or VSN.