
Figures & data
Table 1. Demographic and Korskoff characteristics, individual scores and means (95% confidence intervals) per group.
Figure 1. Example of a no-change display in the visual working memory task.
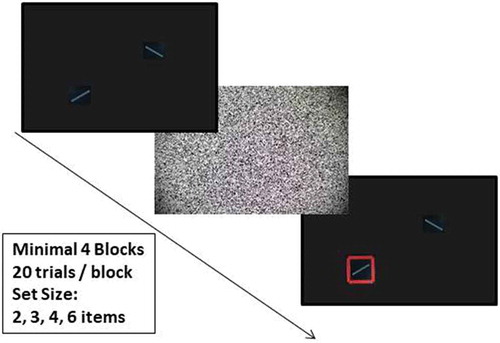
Figure 2. Mean accuracy (%) on set size 2, 3, 4, and 6 of the visual working memory task for Korsakoff’s syndrome (KS) patients (N = 9) and the age- and education- matched control group (N = 30). Individual tests scores are displayed as lines. Error bars indicate 1 standard error of the mean.
Figure 3. Mean Kmax on set size 2, 3, 4, and 6 of the visual working memory task for Korsakoff’s syndrome (KS) patients (N = 9) and the age- and education- matched control group (N= 30). Individual tests scores are displayed as lines. Error bars indicate 1 standard error of the mean.
Table 2. Demographic characteristics and performances on the spatial working memory task, individual scores and means (95% confidence intervals) per group.