Figures & data
Figure 1. Template of the visual search task. Patients were cued with a color (i.e., the central rectangle) and instructed to tap all dots of the same color, and not tap the other dots. Patients were instructed to tap the central rectangle to indicate when they were finished. There was no time limit
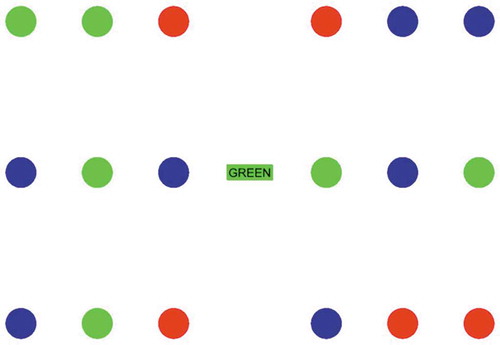
Figure 2. Example trials for each of the 10 conditions that were part of the 36-trial and 54-trial tasks, which were used for the current study. The targets are depicted in red, the distractors in gray. For each condition, there were three trials in which the target rows varied between trials
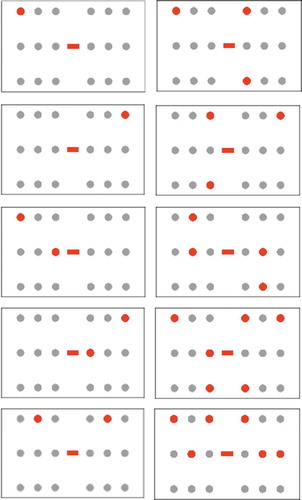
Table 1. Demographic and stroke-related characteristics, median (interquartile range) or percentage, split for 49 patients with left-brain damage without visuospatial neglect (LBD-), 55 right-brain damage without visuospatial neglect (RBD-), and 23 right-brain damage with visuospatial neglect (RBD+).a.
Table 2. Overall hit rate, search speed (i.e., trial duration), search consistency (i.e., best r), revisits (i.e., immediate and delayed), and initial spatial bias (i.e., starting point, center of starting points, search time for a single left and right target) at the visual search task. Medians (interquartile range) split for 49 patients with left-brain damage without visuospatial neglect (LBD-), 55 right-brain damage without visuospatial neglect (RBD-), and 23 right-brain damage with visuospatial neglect (RBD+)
Figure 3. Boxplots depicting the percentage of hits for targets at the ipsilesional (ipsi) and contralesional side (contra), averaged over all conditions. The thick line in the middle is the median. The top and bottom box lines show the first and third quartiles. The whiskers show the maximum and minimum values, with the exceptions of outliers. Individual scores are depicted by gray circles. Data is split for patients with left-brain damage without visuospatial neglect (LBD-), right-brain damage without visuospatial neglect (RBD-), and right-brain damage with visuospatial neglect (RBD+)
Figure 4. Boxplots depicting the search time in seconds to find a single left or right target. The thick line in the middle is the median. The top and bottom box lines show the first and third quartiles. The whiskers show the maximum and minimum values, with the exceptions of outliers, which are depicted by black dots. Data is split for patients with left-brain damage without visuospatial neglect (LBD-), right-brain damage without visuospatial neglect (RBD-), and right-brain damage with visuospatial neglect (RBD+). Only patients who had found this target at least once for each side, and for whom data on timing was present, were included. This was the case for 48 LBD- patients, 53 RBD- patients, and 14 RBD+ patients. The figure on the right shows a representation of example conditions of trials that were included for the analysis. The targets are depicted in red, the distractors in gray
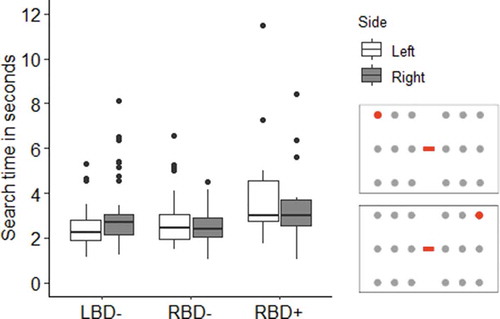
Figure 5. Boxplots depicting the median percentage of hits for the condition with one target per column. Hit percentage is presented for targets at the ipsilesional (Ipsi) and contralesional side (Contra), split per column. Columns 1, 2, and 3 refer to columns at the most ipsilesional side to the most contralesional side. The thick line in the middle is the median. The top and bottom box lines show the first and third quartiles. The whiskers show the maximum and minimum values, with the exceptions of outliers. Individual scores are depicted by gray circles. Data is split for patients with left-brain damage without visuospatial neglect (LBD-), right-brain damage without visuospatial neglect (RBD-), and right-brain damage with visuospatial neglect (RBD+). The figure on the right shows a representation of example conditions of trials that were included for the analysis. The targets are depicted in red, the distractors in gray
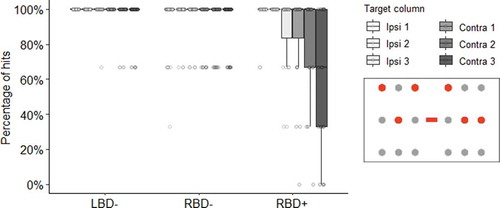
Figure 6. The percentage of hits for conditions with 2, 3, 4 or 6 targets. The thick line in the middle is the median. The top and bottom box lines show the first and third quartiles. The whiskers show the maximum and minimum values, with the exceptions of outliers. Individual scores are depicted by gray circles. Data is split for patients with left-brain damage without visuospatial neglect (LBD-), right-brain damage without visuospatial neglect (RBD-), and right-brain damage with visuospatial neglect (RBD+). The figure on the right shows a representation of example conditions of trials that were included for the analysis. The targets are depicted in red, the distractors in gray
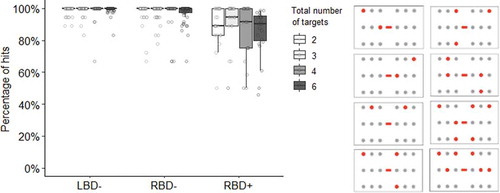
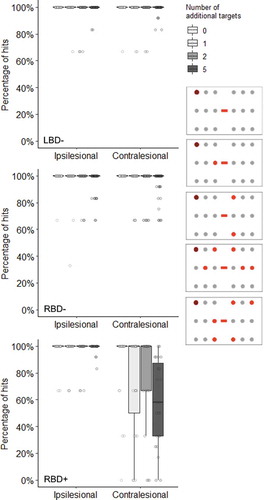
Figure 7. The percentage of hits for conditions with one target in the most peripheral column, and 0, 1, 2, or 5 additional targets in the other columns. Hit percentage is presented for the reference target in the most ipsilesional and most contralesional column, split per number of additional targets (0, 1, 2, or 5). The thick line in the middle is the median. The top and bottom box lines show the first and third quartiles. The whiskers show the maximum and minimum values, with the exceptions of outliers. Individual scores are depicted by gray circles. Data is split for patients with left-brain damage without visuospatial neglect (LBD-), right-brain damage without visuospatial neglect (RBD-), and right-brain damage with visuospatial neglect (RBD+). The figure on the right shows a representation of example conditions of trials that were included for the analysis. The reference target is depicted in dark red, the additional targets in red, and the distractors in gray