
Figures & data
Table 1. Demographic characteristics by ethnic group (n = 83)
Table 2. Effects of ethnicity in the association of SCD-Q with MDRS total scores and follow-up analyses stratified by ethnicity
Figure 1. Ethnic differences in the association of SCD-Q and MDRS total scores.
* p < .05, ** p < .01, *** p < .001.Abbreviations: MDRS = Mattis Dementia Rating Scale; SCD-Q = Subjective Cognitive Decline Questionnaire.Note: MDRS total scores reflect unstandardized residual values, adjusted for age, education, and GDS-15 scores. SCD-Q total scores reflect centered values.
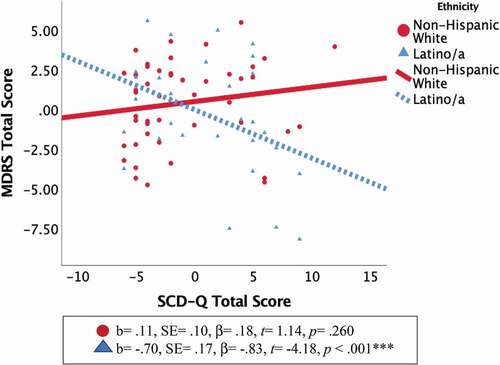
Figure 2. Relationship between self and informant SCD-Q scores and MDRS performance within the Latino/a group (n = 22).
* p < .05, ** p < .01, *** p < .001. Abbreviations: MDRS = Mattis Dementia Rating Scale; SCD-Q = Subjective Cognitive Decline Questionnaire.
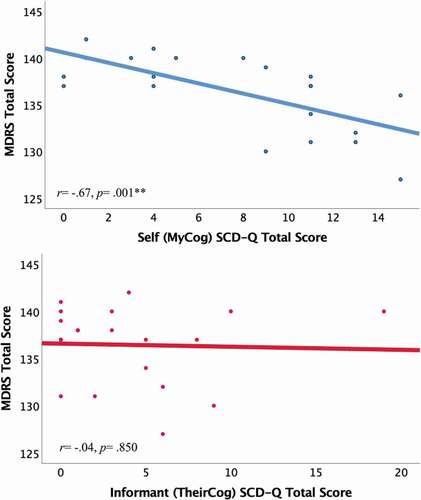
Figure 3. Preliminary associations of self-reported SCD-Q, entorhinal cortex thickness, and left hippocampal volume in Latinos/as (n = 12).
* p<.05, ** p<.01, *** p<.001. Abbreviations: SCD-Q = Subjective Cognitive Decline Questionnaire. Scatterplots depict unstandardized adjusted residuals. Residuals were calculated via regression analyses with covariates as the independent variables and SCD-Q total scores, entorhinal cortex thickness, or hippocampal volume as the dependent variables. Entorhinal thickness was adjusted for age and hippocampal volume was adjusted for age and intracranial volume.
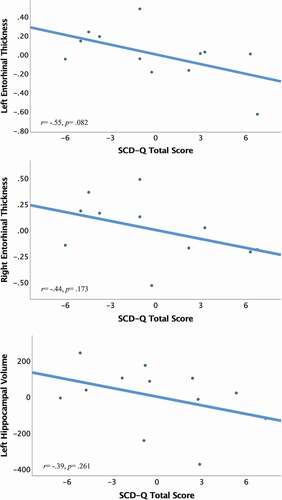
Table 3. Sensitivity analyses: association of SCD-Q scores with MDRS scores filtering groups based on lowest education level and MDRS scores <132
Supplemental material