
Figures & data
Figure 1. Trial structure for the gap/overlap task. In the gap condition the trial commenced with a 400 ms blank screen, after which participants fixated on a central face. Faces were shown for a randomized duration of 600–1200 ms, with a 200 ms gap presented before a target appeared randomly to the left or right. In the overlap condition the trial sequence was identical except that the central face was presented for 800–1400 ms and remained on the screen after the target appeared. In both conditions the target was presented for 400 ms. Participants were required to fixate the face and look toward the target as soon as it appeared.
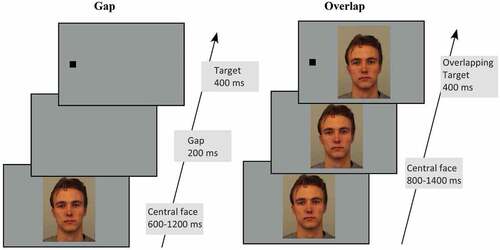
Table 1. Demographic characteristics for low and high autism trait (AT) groups.
Figure 2. Mean Saccade Onset Time (SOT) in the a) gap, and b) overlap conditions across low and high AT groups. Error bars indicate SEM.
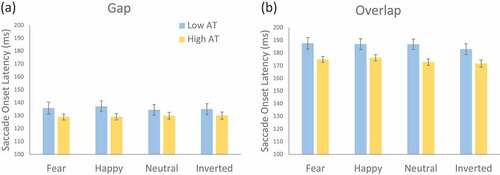
Figure 3. Estimated marginal mean Saccade Onset Times (SOTs) for fearful, happy, neutral, and inverted neutral faces within gap or overlap conditions. Error bars indicate SEM. * p < .05.
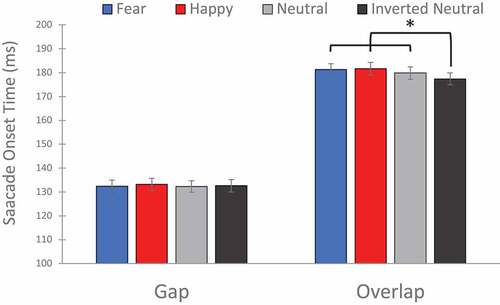
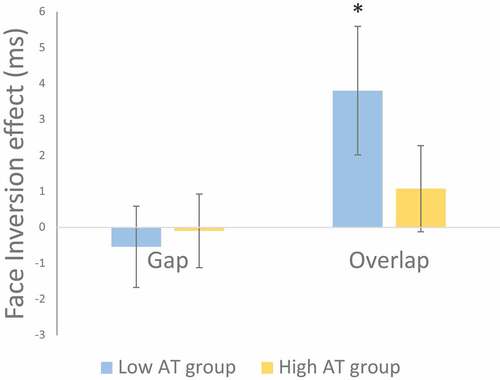
Figure 4. Saccadic face inversion effects were calculated by subtracting the Saccade Onset Time (SOT) for inverted neutral face from upright (neutral) face conditions. A positive inversion effect indicates faster disengagement from inverted compared with upright fixation faces. Only the low AT group demonstrated a significant face inversion effect in the overlap condition. Error bars indicate SEM. * indicates p < .05.
Data availability statement
Data is available by request to the corresponding author.