Figures & data
Figure 1. Axial T2-weighted FLAIR scans of A.V.’s brain. a A.V.’s first MRI exam taken at the onset of HSE infection. b Recent scan taken during our study (8 years post-HSE). The early scan shows signal hyperintensities in the temporal lobes consistent with tissue inflammation. Even though the T2-weighted signal is abnormally bright, the shape of the temporal lobes can be delineated clearly, making it possible to evaluate the topography of the lesion with respect to the original anatomy. Areas of T2-weighted hyperintensity in the original clinical scan coincide with the borders of the lesion in the more recent scan. The right hemisphere is marked by the top blue line; the left hemisphere by the green line (see Fig. 2). Scale bars: 1 cm.
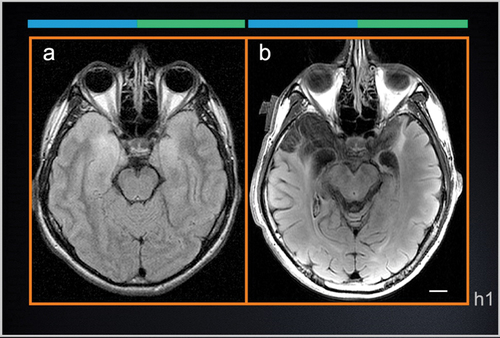
Figure 2. 3-dimensional (3-D) anatomical legend for cross-sectional images of A.V.’s brain. 3D reconstruction of A.V.’s right and left hemispheres of the brain were created to display the relative position of cross-sectional anatomical images of A.V.’s brain displayed in Figs. 1–3 and S1, S2 with respect to cortical anatomy and major surface landmarks. The white and gray lines indicate the plane of section for horizontal (h1-h5), sagittal (s1), and coronal slices (c1-c8). The right hemisphere is colored blue and the left hemisphere is green. Scale cube: 1 cm3.
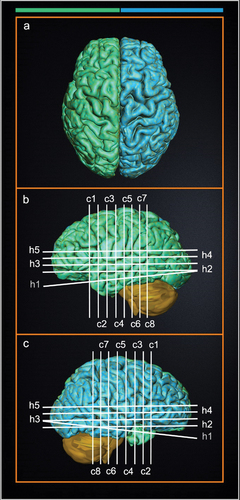
Figure 3. Cross-sectional coronal MRI images through the brain of patient A.V. and an age-matched healthy male. Coronal images provide a comprehensive view of the position of subcortical structures relative to the MTL. Numbered boxes outline major regions of interest in the control brain images to help classify missing or damaged structures (see text). At the top of each column, the blue and green line denote the right hemispheres and left hemispheres respectively (see Fig. 2). Scale bars: 1 cm.
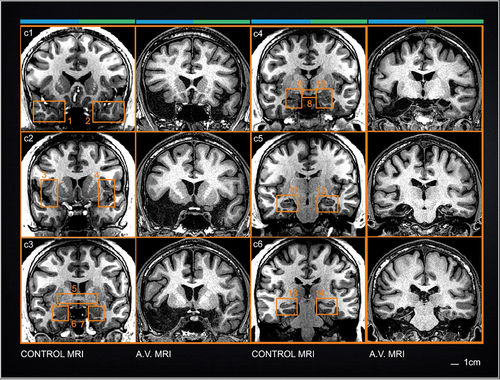
Table 1. A.V.’s general cognition and intellectual functioning.
Table 2. A.V.’s anterograde memory.
Figure 4. Number of errors using the mirror tracing task. Patients A.V. and H.M. completed 30 trials, 10 consecutive trials each day, over 3 consecutive days using their right (dominant) hand. H.M.’s average completion times were calculated based on Milner(Citation1962) (see figure 10 of Milner, Citation1962; note that data from H.M’s first trial was not included in this figure).
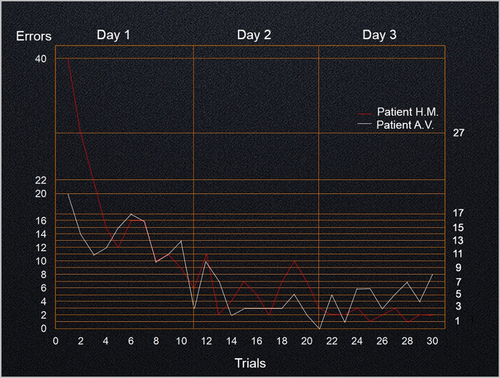
Table 3. Standardized Full Scale IQ and memory test scores for A.V. and other amnesic patients with bilateral MTL lesions.
Table 4. Typical week in A.V.’s life.
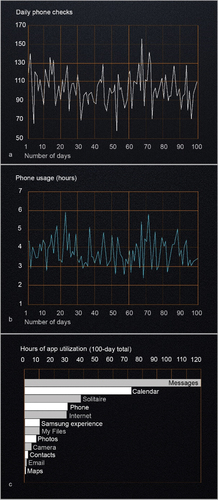
Figure 5. A.V.’s phone and app usage over a 100-day period. The number of times A.V. checked his phone and the daily length of time he used his phone over a 100-day period in figures 5a and 5b, respectively. Figure 5c shows the use of individual apps (in hours) during the same 100-day period. Only apps that were used for one hour or longer were included. A.V. used his phone an average of 3.18 hours/day (average U.S. user data ranges from 2.4 to 3.4 hours/day(Annie, Citation2019; Comscore, Citation2018; Kemp, Citation2020)) and he spent 69% of app usage time on the top 3 apps (average U.S. user percentage is 77%). A.V. played games on his phone for an average of 21 minutes/day (average U.S. user data is 23 minutes/day).