569
Views
0
CrossRef citations to date
0
Altmetric
Research Articles

Methadone maintenance treatment and impulsivity: premature responding

, , , , , & show all
Pages 606-617 | Received 12 Mar 2023, Accepted 23 Oct 2023, Published online: 02 Nov 2023

Figures & data

Figure 1. Example trial parts for the IHT. While the start-hand (marked with an x) turns green upon trial start, the cursor-hand (small) is initially white till it is moved to a predefined location on the right, the cursor-hand then changes color depending on the trial type: green for instructed Go trials (instructed to move the cursor-hand past the red line), red for instructed Stop (instructed to stop moving the cursor-hand as fast as possible), yellow for Choice trials (the participant chooses to either move the cursor-hand past the red line or stop moving as fast as possible). The trial ends when the cursor-hand is fully moved past the red line.

Figure 1. Example trial parts for the IHT. While the start-hand (marked with an x) turns green upon trial start, the cursor-hand (small) is initially white till it is moved to a predefined location on the right, the cursor-hand then changes color depending on the trial type: green for instructed Go trials (instructed to move the cursor-hand past the red line), red for instructed Stop (instructed to stop moving the cursor-hand as fast as possible), yellow for Choice trials (the participant chooses to either move the cursor-hand past the red line or stop moving as fast as possible). The trial ends when the cursor-hand is fully moved past the red line.

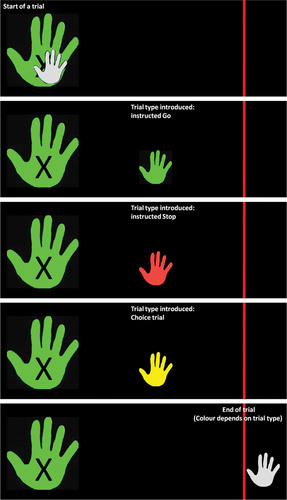
Table 1. Demographics and methadone descriptives.

Figure 2. Bar graph of the significant between-group differences on pre-Cue performance. 2a) shows the number of premature responses in the task, 2b) shows the movement delay and 2c) shows the average speed per group before Cue presentation. ** indicates significance at p < .01, and * significance at p < .05. MMT = methadone maintenance patients, HVs = healthy volunteers.

Figure 2. Bar graph of the significant between-group differences on pre-Cue performance. 2a) shows the number of premature responses in the task, 2b) shows the movement delay and 2c) shows the average speed per group before Cue presentation. ** indicates significance at p < .01, and * significance at p < .05. MMT = methadone maintenance patients, HVs = healthy volunteers.

Figure 3. Bar graphs of significant group effects on response times and accuracy. 3a) shows the significant group differences on response times across Go trials (Choice and instructed). 3b) shows the significant group by trial type interaction on Stop response times, as indicated by Choice Stop response times minus instructed Stop response times. 3c) shows the accuracy rates across instructed Go and Stop trials. *** indicates significance at p < .001, ** indicates significance at p < .01, and * indicates significance at p < .05. MMT = methadone maintenance patients, HVs = healthy volunteers.

Figure 3. Bar graphs of significant group effects on response times and accuracy. 3a) shows the significant group differences on response times across Go trials (Choice and instructed). 3b) shows the significant group by trial type interaction on Stop response times, as indicated by Choice Stop response times minus instructed Stop response times. 3c) shows the accuracy rates across instructed Go and Stop trials. *** indicates significance at p < .001, ** indicates significance at p < .01, and * indicates significance at p < .05. MMT = methadone maintenance patients, HVs = healthy volunteers.