
Figures & data
TABLE 2. Quality appraisal and level of evidence assessment (n = 21).
FIGURE 1. Study identification, screening, and selection process.
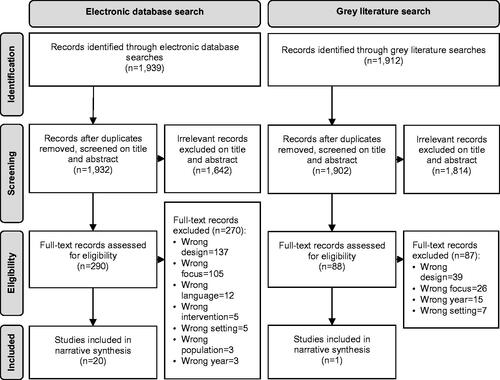
TABLE 1. Study characteristics (n = 21).
TABLE 3. Summary of findings from individual studies (n = 21).
Supplemental material
Supplemental Material
Download MS Word (43.5 KB)DATA AVAILABILITY STATEMENT
The authors confirm that the data supporting the findings of this review are available within the article and its supplementary materials.