
Figures & data
TABLE 1. Characteristics of individuals in contact with psychiatric services who died by suicide (n = 484), crude and adjusted odds ratio (OR) with 95% confidence interval (95% CI) for the association between gender, age, type of diagnosis, and having at least one known previous attempt/s (PSA) vs. without previous attempt/s (NSA).
TABLE 2. Individuals in contact with psychiatric services who died by suicide (n = 484), crude and adjusted odds ratio (OR) with 95% confidence interval (95% CI) for the association between length and proximity of psychiatric contact, absence from appointment, and having at least one known previous attempt/s (PSA) vs. without previous attempt/s (NSA).
FIGURE 1. Proportions (%) with ongoing and planned psychiatric interventions and suicide risk assessment among patients who died by suicide, by suicide attempt history (n = 238).
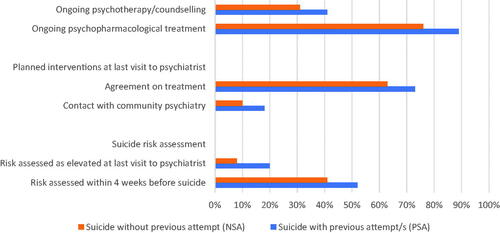
TABLE 3. Crude and adjusted odds ratio (OR) with 95% confidence interval (95% CI) for associations between the ongoing and planned psychiatric interventions, suicide risk assessment, and having at least one known previous attempt/s (PSA) vs. without previous attempt/s (NSA).
DATA AVAILABILITY STATEMENT
Data are available upon reasonable request.