
Figures & data
FIGURE 1. Stages of identification of studies. Results as at 05 November 2021.
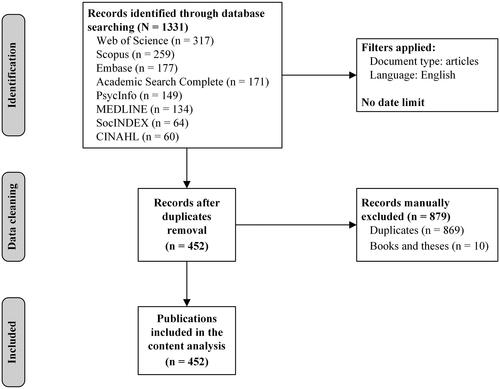
FIGURE 2. Distribution of the masculinity and suicide literature from 1954 to 2021, as at 05 November 2021.
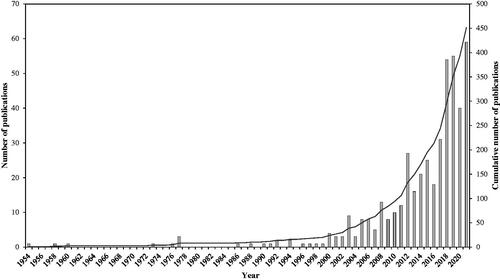
FIGURE 3. Network visualization map of the co-occurrences of terms in title/abstract for publications related to masculinity and suicide (1954–2021). Colors indicate five clusters of related terms, and size of circles represents the occurrences of terms in titles/abstracts.
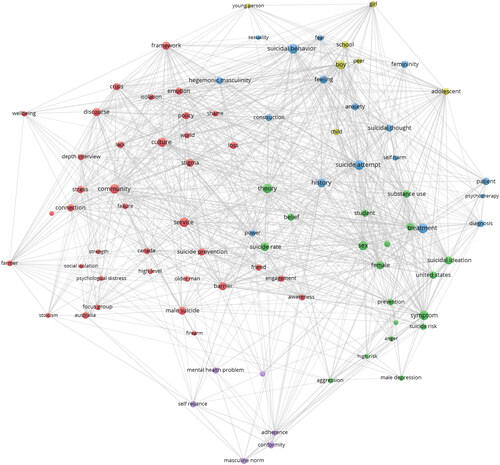
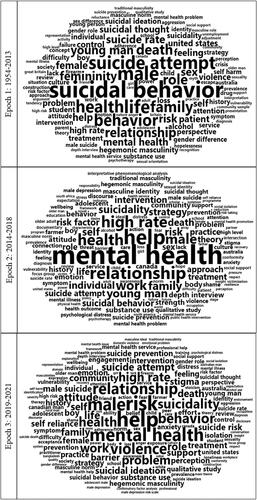
FIGURE 4. Word clouds of the most occurring terms in titles/abstracts for publications related to masculinity and suicide by epoch. Size of font represents the occurrences of terms in titles/abstracts
Supplemental material