
Figures & data
TABLE 1. Count data of suicide outcomes across time.
TABLE 2. Logistic regression to determine association between alcohol consumption and cannabis use overall across time.
FIGURE 1. Sankey plot to show individuals’ suicide outcome over time. W1 and W2 indicate wave 1 and wave 2 respectively showing change over time. Groups based on suicide outcome in past 12 months: neither = no suicidal ideation or suicide attempts; ideation = suicidal ideation; both = suicidal ideation and attempts.
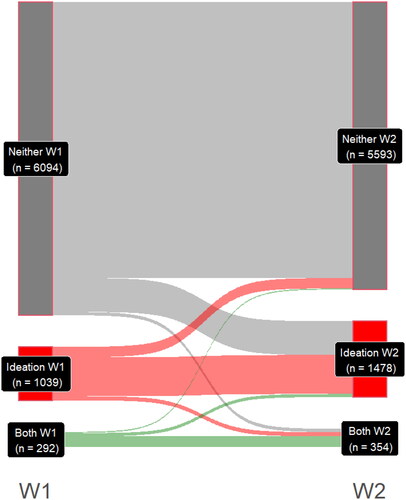
TABLE 3. Descriptive statistics of alcohol consumption and cannabis use for each transition group.
TABLE 4. Binomial regression to determine association between alcohol consumption and cannabis use and suicide outcome.