
Figures & data
TABLE 1. Patient demographic and clinical characteristics (N = 778).
FIGURE 1. Severity of suicidal ideation during and after treatment (N = 778).
Notes: Suicidal ideation over the last 2 weeks is measured by the ninth item of the Patient Health Questionnaire-9 item (PHQ-9), with 0 = not at all, 1 = several days, 2 = more than half the days, and 3 = nearly every day. Non-significant Wilcoxon Test comparisons for changes in suicidal ideation are not shown. That is, there were no significant differences between end-of-treatment and 3-month follow-up, between end-of-treatment and 6-month follow-up, or between 3-month and 6-month follow-up.
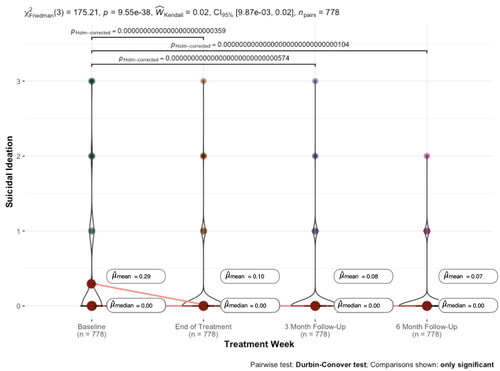
FIGURE 2. Suicidal ideation during and after treatment by baseline depressive symptom severity.
Notes: Suicidal ideation over the last 2 weeks is measured by the ninth item of the Patient Health Questionnaire-9 item (PHQ-9), with 0 = not at all, 1 = several days, 2 = more than half the days, and 3 = nearly every day. Treatment week 0 is the pretreatment (baseline) assessment. Treatment week 12 is the end-of-treatment assessment. Treatment week 25 is the 3-month follow-up assessment. Treatment week 38 is the 6-month follow-up assessment. Symptom severity is measured by baseline PHQ-8 score as follows: less than mild = 0–4, mild = 5–9, moderate = 10–14, moderately severe = 15–19, severe = 20+. Light lines are individual trajectories and dark lines are pretreatment symptom severity group trajectories.
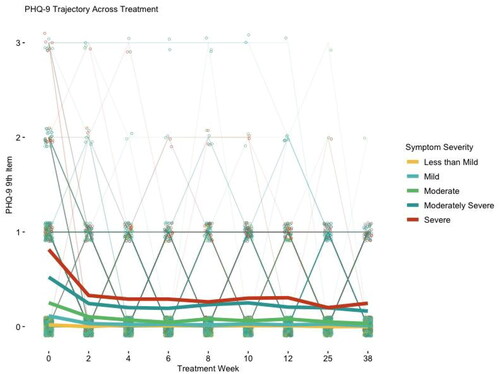
TABLE 2. Suicidal ideation during and after treatment.
TABLE 3. Adjusted associations of changes in suicidal ideation across meru health program treatment.