
Figures & data
FIGURE 1. PRISMA flow diagram.
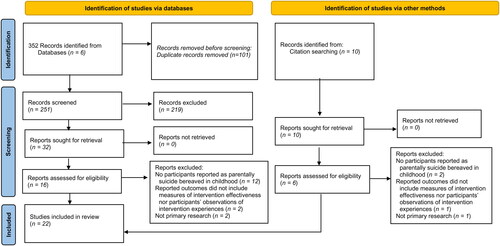
TABLE 1. Summary of included studies and interventions (sorted by study design, and alphabetically by intervention).
FIGURE 2. Quantitative evidence: Significant intervention effects. Organized by: (a) study design; (b) intervention type; and (c) participant ages at intervention/ research participation.
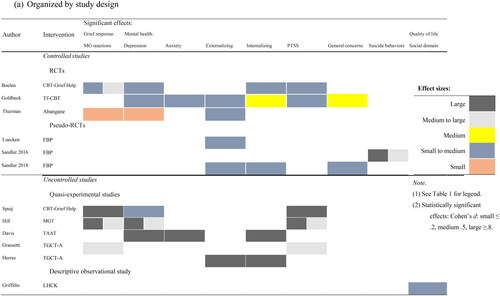
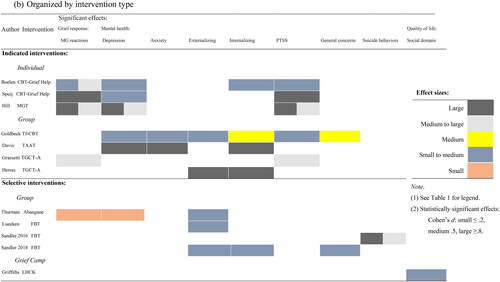
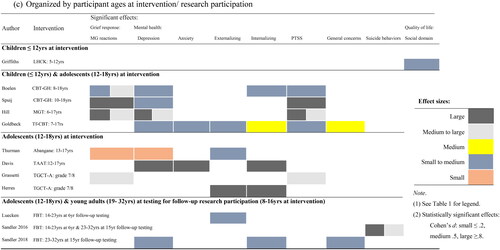
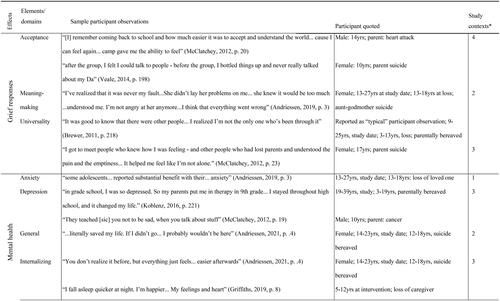
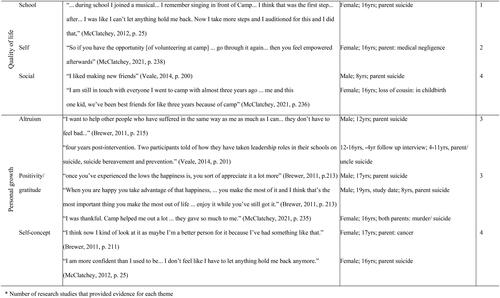
FIGURE 3. Perceived utility: Qualitative evidence. *Number of research studies that provided evidence for each theme.
Supplemental material
Supplemental-file-6.docx
Download MS Word (40.3 KB)Supplemental-file-5.docx
Download MS Word (32.7 KB)Supplemental-file-3.docx
Download MS Word (29.8 KB)Supplemental-file-2.docx
Download MS Word (35.9 KB)Supplemental-file-1.docx
Download MS Word (30.9 KB)Supplemental-file-4.docx
Download MS Word (31.6 KB)DATA AVAILABILITY STATEMENT
The authors confirm that the data supporting the findings of this study are available within the article and/or its supplementary files.
