Figures & data

FIGURE 1. PRISMA (Moher et al., Citation2009) diagram of review identification, screening, and selection.

FIGURE 1. PRISMA (Moher et al., Citation2009) diagram of review identification, screening, and selection.

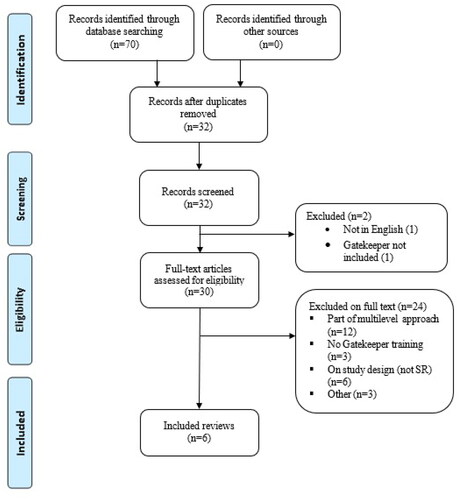
TABLE 1. Participant, study design, criteria, and outcome of systematic reviews.

TABLE 2. Tabular presentation for ROBIS results.

Supplemental material

ESM 2 Table 4 ROBIS Template.xlsx

Download MS Excel (57.6 KB)

ESM 1 TAble 2 Individual studies included in the identified systematic reviews.docx

Download MS Word (31.4 KB)

ESM 3 Table 5 Characteristics of individual studies.pdf

Download PDF (396.2 KB)