Publication Cover
Archives of Physiology and Biochemistry
The Journal of Metabolic Diseases
Volume 127, 2021 - Issue 5
2,241
Views
3
CrossRef citations to date
0
Altmetric
Review Article

Visfatin level and gestational diabetes mellitus: a systematic review and meta-analysis

, , &
Pages 468-478 | Received 10 Sep 2020, Accepted 07 Jan 2021, Published online: 21 Jan 2021

Figures & data

Figure 1. Flow diagram of study recruiting.

Figure 1. Flow diagram of study recruiting.

Table 1. Characteristics of studies included in the meta-analysis.

Figure 2. Risk of bias graph. The Cochrane collaboration’s tool was used to evaluate risk of bias.

Figure 2. Risk of bias graph. The Cochrane collaboration’s tool was used to evaluate risk of bias.

Figure 3. Forest plot of circulating visfatin level in GDM or healthy pregnant women. The random effect model (Inverse Variance method) was applied.

Figure 3. Forest plot of circulating visfatin level in GDM or healthy pregnant women. The random effect model (Inverse Variance method) was applied.

Figure 4. Begg’s funnel plot of included studies for potential publication bias.

Figure 4. Begg’s funnel plot of included studies for potential publication bias.

Figure 5. Sensitivity analysis of the circulating visfatin levels in GDM or healthy pregnant women.

Figure 5. Sensitivity analysis of the circulating visfatin levels in GDM or healthy pregnant women.

Figure 6. Subgroup analysis of visfatin levels in GDM or healthy pregnant women based on average BMI. The random effect model (Inverse Variance method) was applied.

Figure 6. Subgroup analysis of visfatin levels in GDM or healthy pregnant women based on average BMI. The random effect model (Inverse Variance method) was applied.

Figure 7. Subgroup analysis of visfatin levels in GDM or healthy pregnant women based on measurement trimester. The random effect model (Inverse Variance method) was applied.

Figure 7. Subgroup analysis of visfatin levels in GDM or healthy pregnant women based on measurement trimester. The random effect model (Inverse Variance method) was applied.

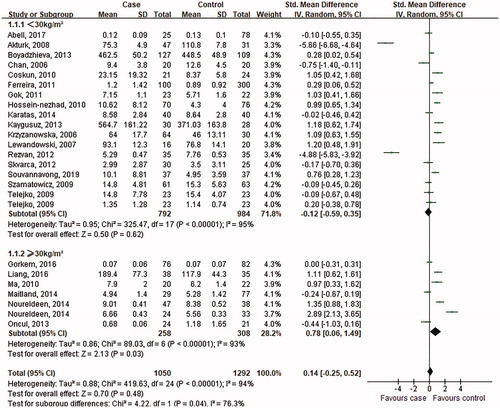
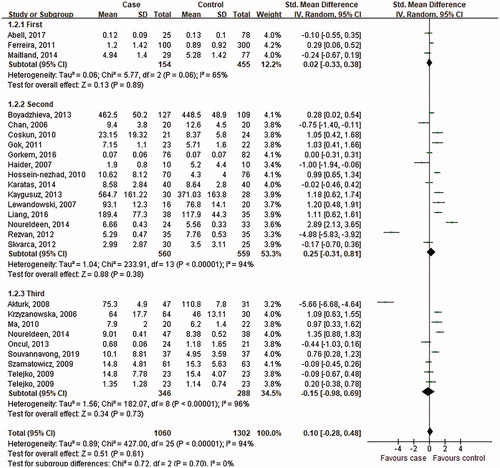
Table 2. Subgroup meta-analysis of the included studies.

Data availability statement

The data that support the findings of this study are available on request from the corresponding author, FX Gong. The data are not publicly available due to the containing information that could compromise the privacy of research participants.