
Figures & data
Table 1. Primer sequences of mRNA and lncRNA.
Figure 1. Characterisation of the HaCaT-derived small extracellular vesicles (sEV). (A) The ultrastructure of the two types of sEV was observed using transmission electron microscopy (TEM). Scale bar: 200 nm. Red arrow indicates the representative morphology of the sEV. (B) The size distribution of the sEV was measured using NanoSight analysis. (C) sEV-related markers and negative markers were detected using western blotting. (D) Laser scanning confocal microscopy was used to detect the presence of HaCaT-derived sEV (pre-labelled with PKH26) in fibroblasts.
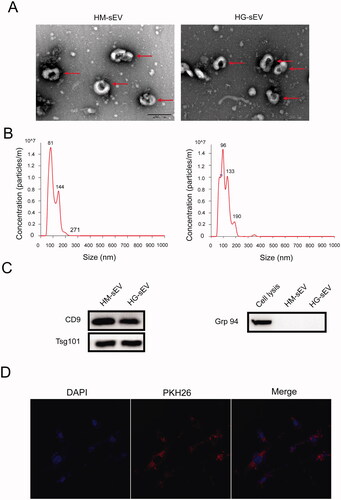
Figure 2. HaCaT-HG-sEV inhibits the biological function of fibroblasts. (A–D) The migration ability of fibroblasts treated with PBS, HM-sEV, or HG-sEV was examined using scratch and transwell assays. (E, F) The protein expression levels of collagen types I and III in fibroblasts treated with PBS, HM-sEV, or HG-sEV were examined using western blotting. (G) The mRNA expression of collagen I and III was validated using quantitative real-time polymerase chain reaction (qRT-PCR). (H) The levels of collagen I and III were examined using enzyme-linked immunosorbent assay (ELISA) kit. (I–K) Cell proliferation level was measured using CCK-8 and Edu staining assay. (L–O) Cell apoptosis and cell cycle were analysed using flow cytometry. *p < 0.05, **p < 0.01, ***p < 0.001.
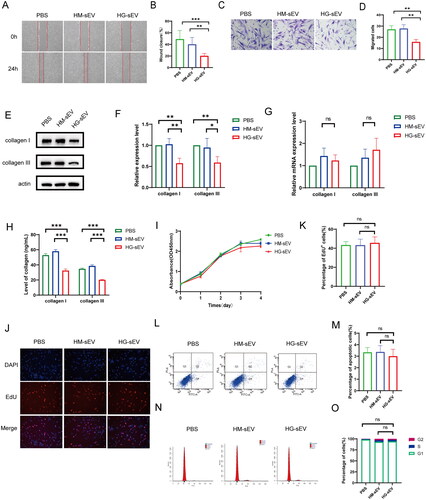
Figure 3. sEV-packaged LINC01435 suppresses biological function in human skin fibroblasts. (A–C) qRT-PCR was used to detect the differential expression of LINC01435 in HaCaT cells, HaCaT-sEV, and fibroblasts stimulated using high glucose. (D) qRT-PCR was used to confirm successful transfection of plasmid carrying LINC01435 into fibroblasts. (E–H) The migration ability of LINC01435-overexpressing fibroblasts was examined using scratch and transwell assays. (I, J) The protein expression of collagen I and III in LINC01435-overexpressing fibroblasts was examined using western blotting. (K) The levels of collagen I and III were examined using ELISA kits. (L) mRNA expression of collagen I and III was validated using qRT-PCR. (M) Cell proliferation level was measured using a CCK-8 assay. (N, O) Cell apoptosis was analysed using flow cytometry. *p < 0.05, **p < 0.01, ***p < 0.001.
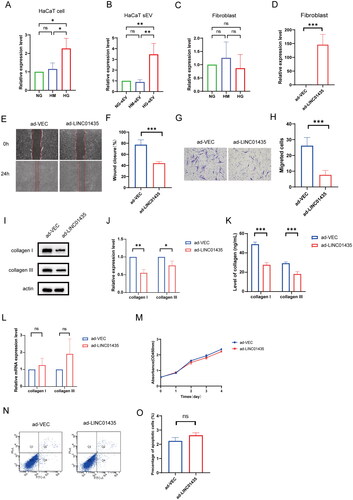
Figure 4. LINC01435 suppresses the biological function of fibroblasts by triggering autophagy. (A) TEM analysis of fibroblasts treated with PBS, HM-sEV, or HG-sEV. Arrow heads indicate autophagosomes. (B, C) The expression of the autophagy-related proteins LC3 and Beclin-1 in fibroblasts treated with PBS, HM-sEV, or HG-sEV was examined using western blotting. (D) TEM analysis of LINC01435-overexpressing fibroblasts. Arrow heads indicate autophagosomes. (E, F) The expression of the autophagy-related proteins LC3 and Beclin-1 in LINC01435-overexpressing fibroblasts was detected using western blotting. (G) The expression of the autophagy-related proteins LC3 and Beclin-1 in LINC01435-overexpressing fibroblasts was detected using immunofluorescence assay. (H, I) Autophagy flux was observed in LINC01435-overexpressing fibroblasts infected with MRFP-GFP-LC3 using laser confocal microscopy, and semi-quantitative analysis of autophagosomes and autolysosomes (including the yellow and red fluorescent spots in merged images) was conducted. (J–M) Treatment with 3-MA restored collagen protein expression and the migration ability in LINC01435-overexpressing fibroblasts. *p < 0.05, **p < 0.01, ***p < 0.001.
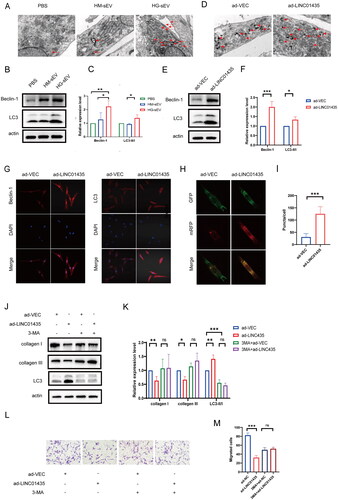
Figure 5. HG-sEV suppress cutaneous wound healing in db/db mice in vivo. (A, B) Representative images of cutaneous wounds treated with PBS, HM-sEV, or HG-sEV at 0, 6, and 11 days post-wounding. (C) HE staining of wound sections after different treatments at 11 days post-wounding. The double-headed arrows represent the edge of the scar. (D) The extent of scar widths of three groups was measured at 11 days post-wounding. (E) Transmitted light images of Masson’s staining and Sirius red staining of three groups to evaluate collagen maturity. (F, G) Immunohistochemical staining to determine collagen I and III, Beclin-1, and LC3B protein expression in skin tissues and related quantitative analyses were performed according to the IRS. *p < 0.05, **p < 0.01, ***p < 0.001.
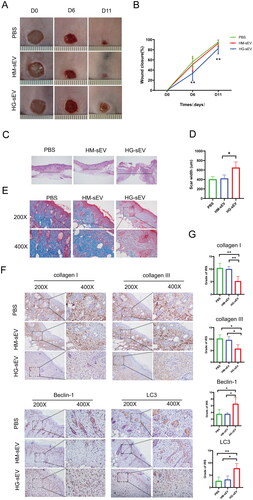
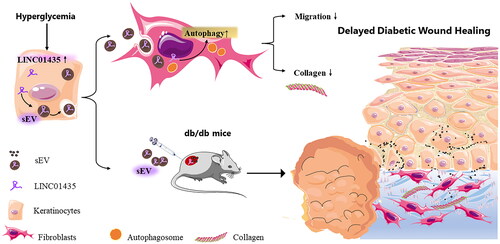
Figure 6. Schematic of the potential mechanism by which HaCaT-sEV regulates the biological functions of fibroblasts in diabetic wound healing. In this study, LINC01435-containing HG-sEV were transferred to skin fibroblasts, triggering autophagy and decreasing collagen synthesis in fibroblasts, thereby delaying wound healing in vivo.
Data availability statement
The data that support the findings of this study are available on request from the corresponding author (LY).