903
Views
31
CrossRef citations to date
0
Altmetric
ORIGINAL ARTICLE

What went and what came? Morbidity trends in general practice from the Netherlands

, , &
Pages 13-24 | Published online: 11 Jul 2009

Figures & data

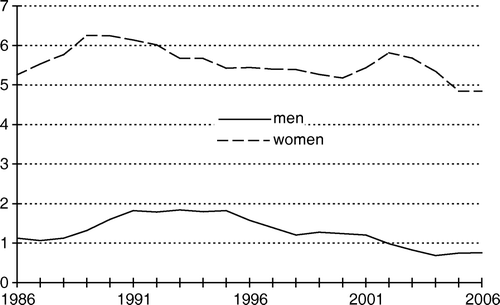
Figure 1.  Hyperthyroidism (prevalence, trend line).

Figure 1.  Hyperthyroidism (prevalence, trend line).

Figure 2.  Hypothyroidism (prevalence, trend line).

Figure 2.  Hypothyroidism (prevalence, trend line).

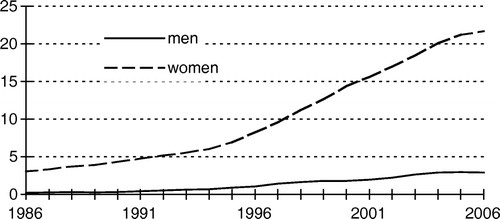
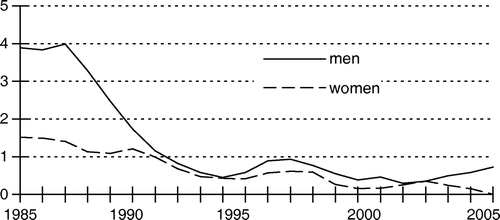
Figure 3.  Depression (prevalence, trend line).

Figure 3.  Depression (prevalence, trend line).

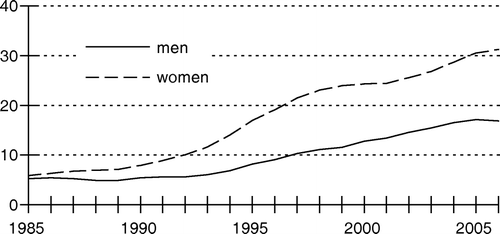
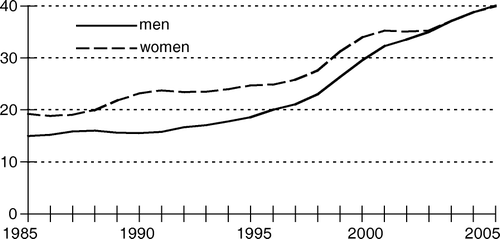
Figure 4.  Anxiety disorders (prevalence, trend line).

Figure 4.  Anxiety disorders (prevalence, trend line).

Figure 5.  Pinworms (prevalence, trend line).

Figure 5.  Pinworms (prevalence, trend line).

Figure 6.  Duodenal ulcer (prevalence, trend line).

Figure 6.  Duodenal ulcer (prevalence, trend line).

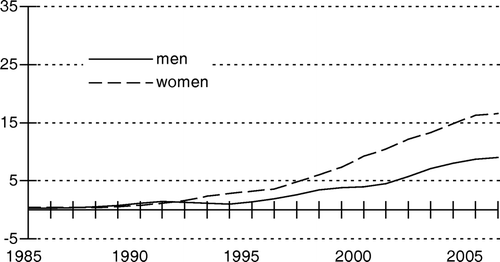
Figure 7.  Diabetes (prevalence, trend line).

Figure 7.  Diabetes (prevalence, trend line).

Figure 1.  CMR population and Dutch population for men (CBS; Statistics Netherlands 2000) (percentages) according to age group (years).
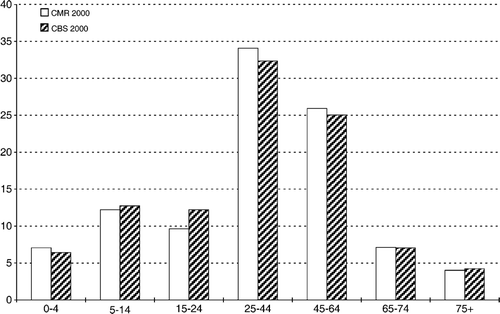
Figure 1.  CMR population and Dutch population for men (CBS; Statistics Netherlands 2000) (percentages) according to age group (years).

Figure 2.  CMR population and Dutch population for women (CBS; Statistics Netherlands 2000) (percentages) according to age group (years).
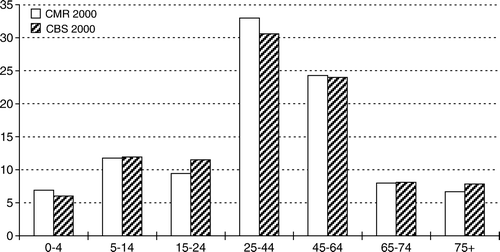
Figure 2.  CMR population and Dutch population for women (CBS; Statistics Netherlands 2000) (percentages) according to age group (years).

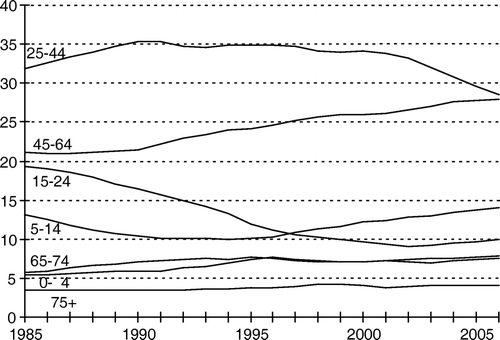
Figure 3.  Trend in age distributions for men 1985–2005 (percentages).

Figure 3.  Trend in age distributions for men 1985–2005 (percentages).

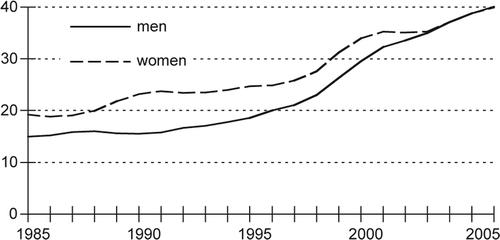
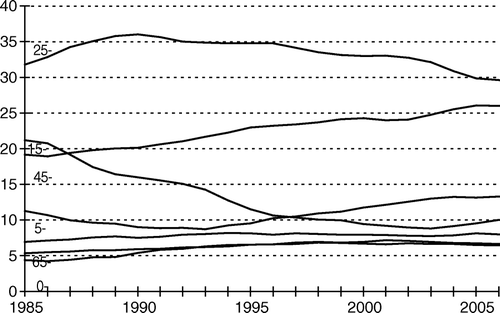
Figure 4.  Trend in age distributions for women 1985–2005 (percentages).

Figure 4.  Trend in age distributions for women 1985–2005 (percentages).

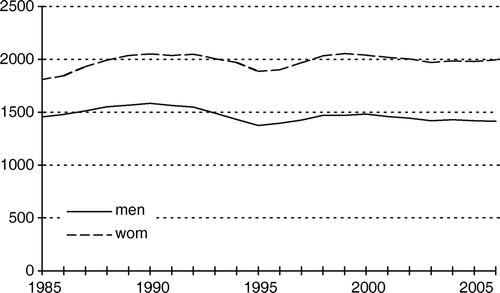
Figure 5.  Trend for overall morbidity: incidence rates.

Figure 5.  Trend for overall morbidity: incidence rates.

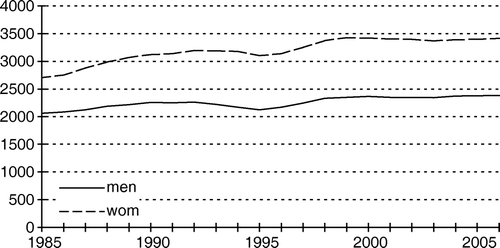
Figure 6.  Trend for overall morbidity: prevalence rates.

Figure 6.  Trend for overall morbidity: prevalence rates.

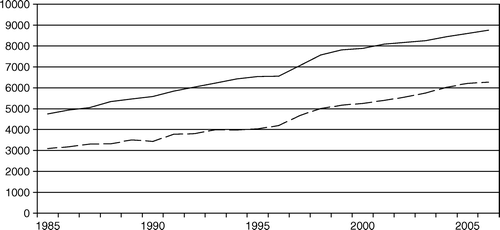
Figure 7.  Trend for chronic morbidity: incidence rates.

Figure 7.  Trend for chronic morbidity: incidence rates.

Table I.  Incidence rates, prevalence rates, and annual percentage change (APC).

Table II.  Seasonal trends for respiratory infections (period 2001–2006): percentage spread over the year.

Table III.  Influence of socio-economic status (SES): prevalence rates for SES (patients/1000/year).
Reprints and Corporate Permissions

Please note: Selecting permissions does not provide access to the full text of the article, please see our help page How do I view content?

To request a reprint or corporate permissions for this article, please click on the relevant link below:

Academic Permissions

Please note: Selecting permissions does not provide access to the full text of the article, please see our help page How do I view content?

Obtain permissions instantly via Rightslink by clicking on the button below:

If you are unable to obtain permissions via Rightslink, please complete and submit this Permissions form. For more information, please visit our Permissions help page.