Figures & data
Table 1. Community sample demographics by cognitive impairment risk group.
Table 2. Community sample clinical characteristics and performance on MMSE, TYM, and GPCog by cognitive impairment risk group.
Table 3. Associations between demographic characteristics, TYM, MMSE and GPCog total scores. Zero-order Pearson correlations are shown above the diagonal and partial correlations controlling for age and education below the diagonal.
Figure 1. Receiver Operating Characteristic Curves of TYM (upper panel) and GPCog scores (lower panel) for detecting risk of cognitive impairment based on MMSE performance.
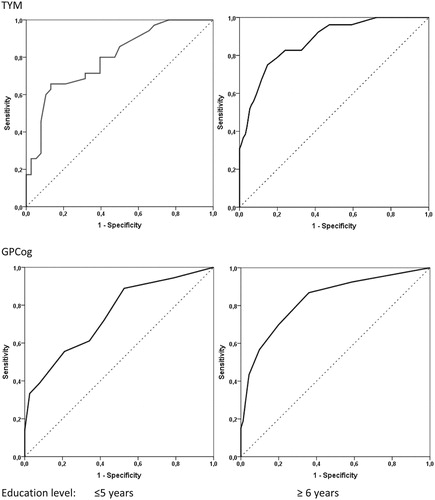
Table 4. Sensitivity and specificity for identifying at risk individuals using TYM and GPCog scores against MMSE-defined cognitive impairment risk. Optimal cut-off values associated with maximum J index (Sensitivity + Specificity –1).
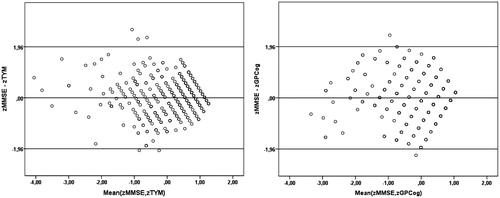
Figure 2. Bland–Altman plots illustrating the distribution of standardized score differences for each pair of tests (MMSE minus TYM in the left-hand panel and MMSE minus GPCog in the right-hand panel) as a function of corresponding average scores.