
Figures & data
Figure 1. Selection of study patients from participants of the baseline survey of a primary healthcare service development programme.
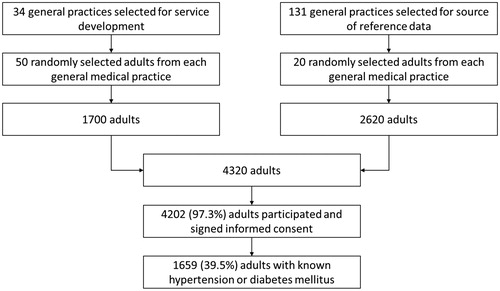
Table 1. Proportion of adult patients with hypertension or diabetes mellitus, who strongly agreed with statements related to health attitudes, and the factors identified in the principal component analysis (n = 1659).
Table 2. Distribution of patients’ characteristics in the study sample (1659 adult patients with hypertension or diabetes mellitus).
Table 3. Unadjusted service utilization frequencies for the investigated preventive services among adult patients with hypertension or diabetes mellitus (n = 1659).
Table 4. Preventive service utilization in the studied sample of adult patients with hypertension or diabetes mellitus, and the median ratioTable Footnotea of patients’ preventive service utilization within groups of preventive services (n = 1659).
Table 5. Patient characteristics influencing the utilization of preventive services by GPs according to hierarchical multivariate logistic regression models with general practice effects (ORs with 95%CIs; n = 1659).