
Figures & data
Table 1. Green (preferred) and red (to be avoided) antibiotics in primary care.
Figure 1. Patient education leaflet based on the ‘undertheweather’ campaign.
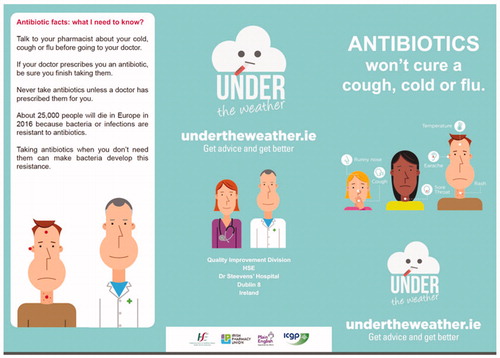
Table 2. Prescription of green/red/co-amoxyclav prescribing before and after the intervention and p-value of comparison before/after (Chi square).
Figure 2. Overview of the mean percentage red and green prescribing in the corresponding weeks before (top panel) and after (bottom panel) the intervention. For the purpose of this figure, the total number of red and green prescriptions was equalled to 100%.
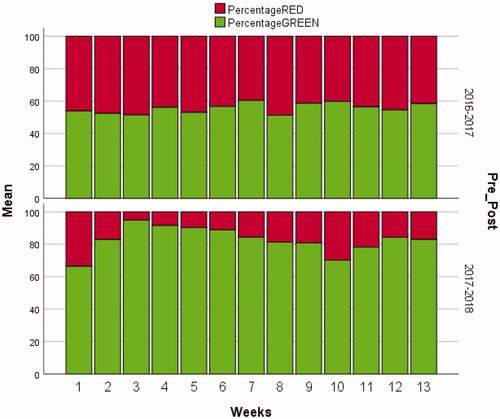
Figure 3. Overview of the pre- and post-intervention co-amoxyclav prescribing as percentage of the total amount of antimicrobials prescribed.
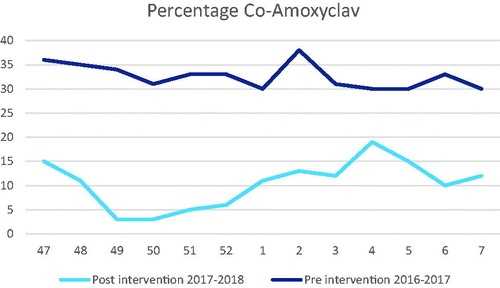
Table 3. Detail of the antibiotic prescriptions before and after the intervention according to the green/red categorisation.