
Figures & data
Table 1. Characteristics of the study population.
Figure 1. Median CRP levels in the different degrees of suspicion after CRP testing (p < 0.001), Kruskal–Wallis test. Circles and asterisk represent outliers and extreme outliers, respectively (box and whisker plot).
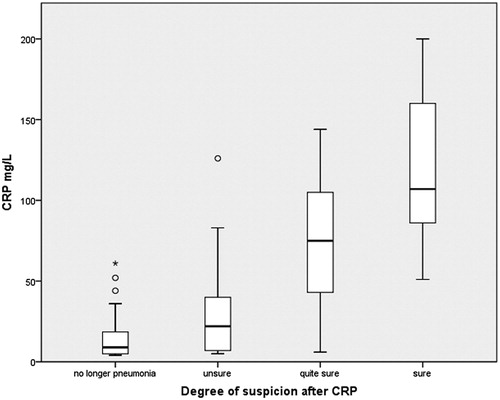
Figure 2. Distribution and shift in degree of suspicion before and after the CRP results. The narrow bars, in the upper part, represent the shift in degree of suspicion.
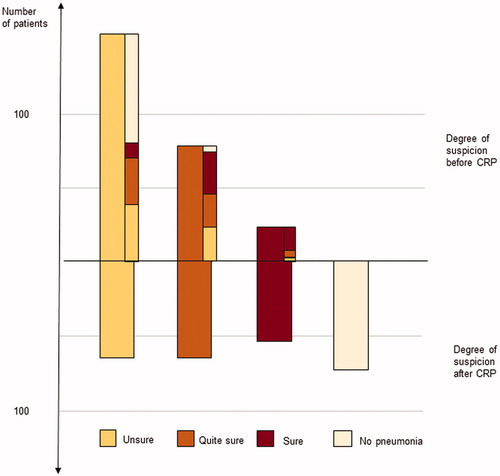
Table 2. Propensity of any degree of suspicion of pneumonia after CRP testing.