Figures & data
Table 1. Characteristics of participants/practices and experiences with COVID-19 in practices and nursing homes. Figures presented are absolute frequencies (percentages) or medians (25th/75th percentiles).
Figure 1. Radar charts showing the answer patterns of the four archetpyes (black = sceptics, red = hardliners, green = balancers, and blue = anxious) regarding anxiety and depressive symptoms and concerns (a), and for threat posed by COVID-19 and the basic dilemma (b). The innermost circles indicate strong approval, the outermost circles strong disagreement.
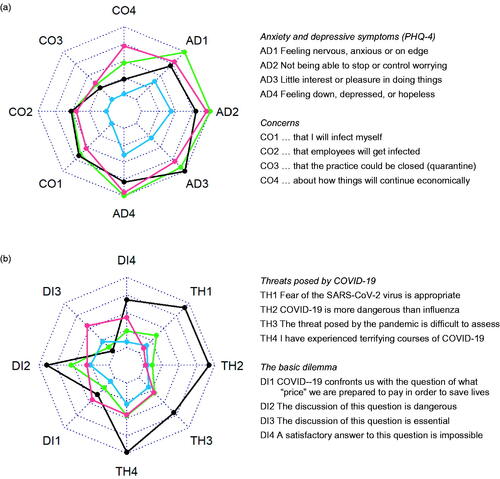
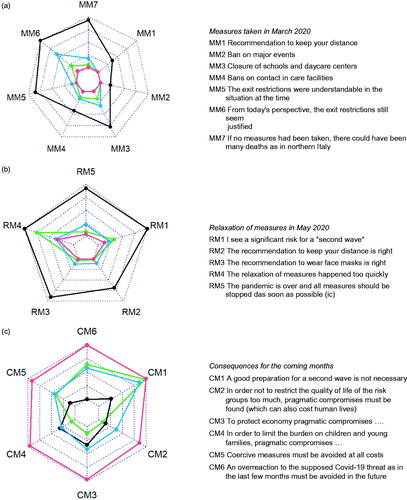
Figure 2. Radar charts showing the answer patterns of the four archetpyes (black =sceptics, red = hardliners, green = balancers, and blue = anxious) regarding measures taken in March 2020 (a), relaxations in May 2020 (b), and consequences for the coming months (c). The innermost circles indicate strong approval, the outermost circles strong disagreement. For reasons of readability some items were inversely coded (= ic) or reworded.