
Figures & data
Figure 1. Study flow diagram.
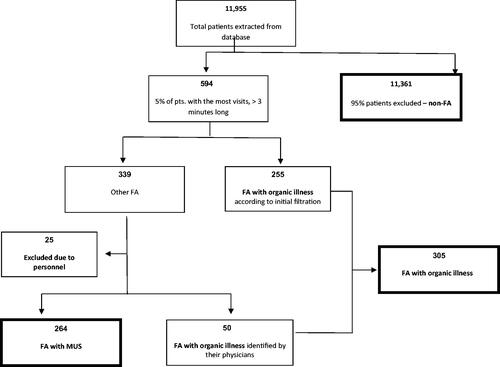
Table 1. Cohort characteristics of frequent attenders (FA) with medically unexplained symptoms (MUS), FA with organic illness (OI) and general clinic population (Non-FA).
Figure 2. Percentage of patients utilising various healthcare services. OI: organic illness; FA: frequent attenders; MUS: medically unexplained symptoms; non-FA: non-frequent attenders (i.e. the general clinic population). This figure shows the percentage of individuals in each group using each hospital service or type of procedure.
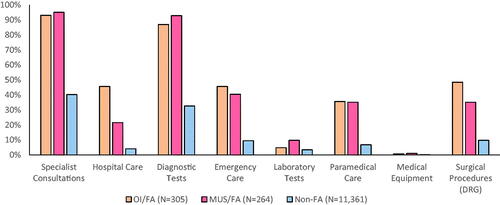
Table 2. Healthcare utilisation in primary and secondary care.
Figure 3. Annual total costs of study population. OI: organic illness; FA: frequent attenders; MUS: medically unexplained symptoms; non-FA: non-frequent attenders (i.e. the general clinic population). This boxplot shows both the mean and median total costs per person for each group in the study population. Both groups of FA have significantly higher mean and median costs than Non-FA. For FA/OI, there is a greater difference between mean and median costs than for FA/MUS. This is likely due to outliers with severe organic illness who have much higher annual healthcare costs. This would raise mean costs without impacting the median; a situation which is less common for patients with medically unexplained symptoms.
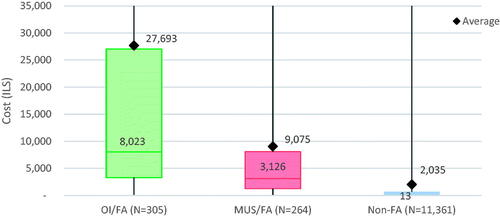
Table 3. Healthcare costs (ILS).
Table 4. Linear regression for group affiliation, age and gender.