
Figures & data
Figure 1. Flowchart of patient selection.
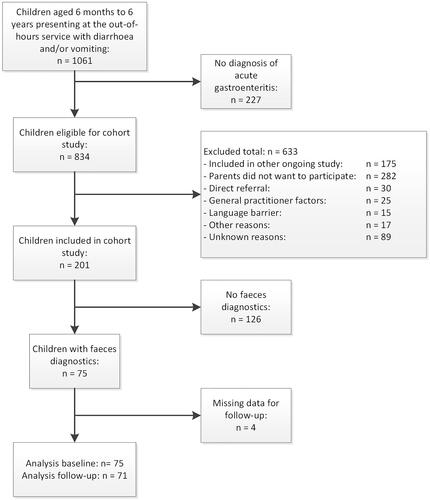
Table 1. Baseline characteristics of the total cohort, included children, excluded children and children included in the trial.
Table 2. Prevalence different pathogens and corresponding cycle threshold values (N = 75).
Table 3. Differences between pathogens and factors related to the course of acute gastroenteritis.
Supplemental material