
Figures & data
Table 1. Epidemiological data – diagnostics and codes.
Table 2. Criteria to include electronic eForms in the study.
Figure 1. Comparison between the Barometer’s data on the number of contacts with a GP for 100,000 inhabitants for suspected or confirmed COVID-19 or acute respiratory infection (ARI) and the official Belgian data on new cases of COVID-19.
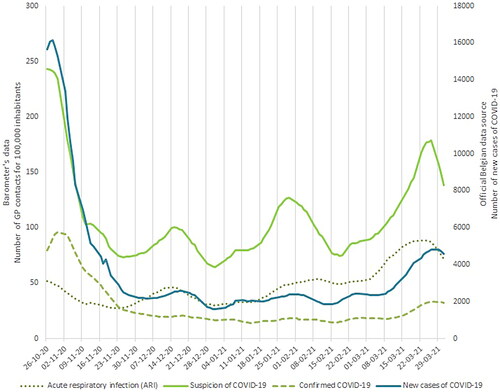
Table 3. Description of the variables from the Barometer and the Belgian official data sources.
Figure 2. Comparison between the Barometer’s data on the number of contacts with a GP for 100,000 inhabitants for suspected or confirmed COVID-19 or acute respiratory infection (ARI) and the official Belgian data on hospitalisations for COVID-19.
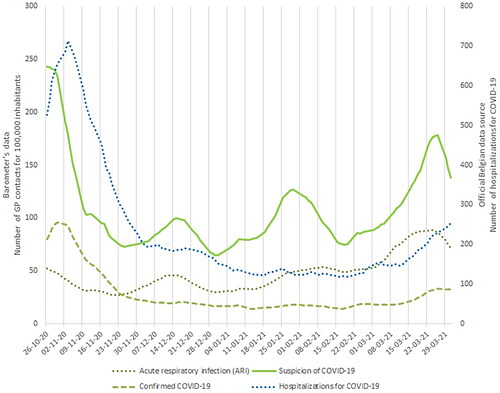
Table 4. Positive components and areas of improvement.