Figures & data
Figure 1. Flow chart of in- and exclusions.
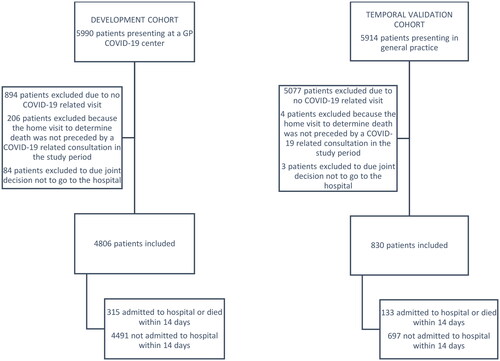
Table 1a. Patient demographics and clinical features are used for the development (n = 4,806) and validation (n = 830) cohort separately.
Table 1b. Reported symptoms and vital signs were recorded during the first GP consultation, for the development (n = 4,806) and validation (n = 830) cohort separately.
Table 2. Outcomes for the development (n = 4,806) and validation (n = 830) cohort separately.
Table 3. Model performance (leave-region-out cross-validation and temporal validation).
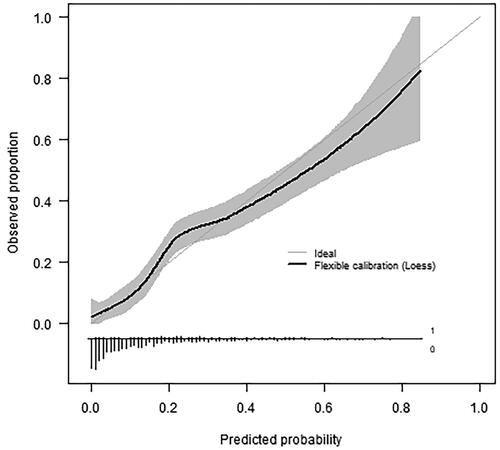
Figure 2. Flexible calibration curve in the temporal validation cohort (n = 830, 133 events) showing the predicted probability of hospital admission versus the observed proportion with hospital admission. The histogram on the horizontal axis shows the distribution of predicted risks among patients with (1, bars pointing upward) and without (0, bars pointing downward) hospital admission. Very short bars at predicted probabilities >0.5 indicate high predicted admission risks are rare.