
Figures & data
Table 1. Study population demographics.
Figure 1. Consultation rates per age and sex categories over time.
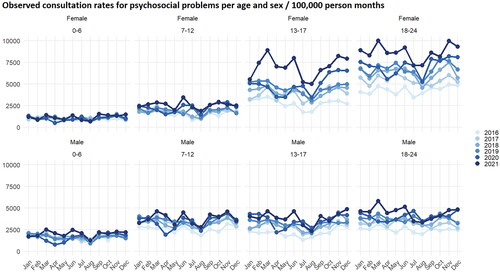
Figure 2. Expected and observed consultation rates over time.
Figure 2a shows the observed monthly psychosocial consultation rates and the expected rates based on Model 1.
Figure 2b shows the observed non-psychosocial rates and the expected rates based on Model 2. The shaded area indicates the pandemic period with the first wave in dark grey.
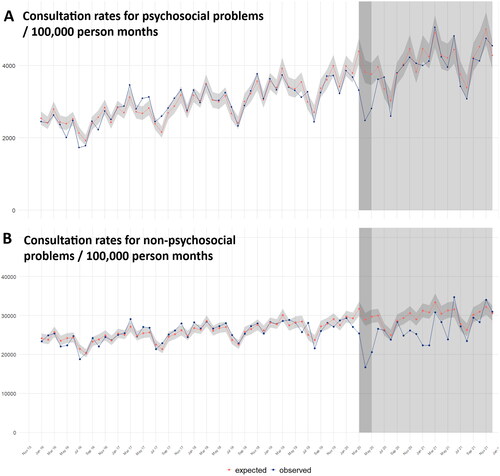
Table 2. Regression table of model 3 estimating the effect of COVID-19 indices on consultation rates.
Table 3. Regression table of model 4 estimating the effect of COVID-19 indices in different age categories.
Supplemental material