Figures & data
Table 1. Patient demographics and mutations
Table 2. Visual function
Figure 1. Pedigrees with diagnosis for 8 families with autosomal recessive retinitis pigmentosa (arRP). Numbered patients had genetic testing. Symbols with black were patients diagnosed with arRP. The results for patients who performed the smell identification test are in color
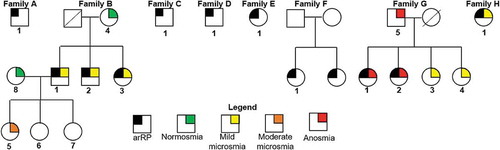
Table 3. Novel variants
Figure 2. Schematic representation of the CNGB1 protein (top) from the canonical transcript NM_001297.4 (bottom). CNGB1 has six transmembrane (TM) domains, a pore loop domain between the fifth and sixth transmembrane domains, and intracellular N- and C-termini. CNGB1 has a large glutamic acid-rich protein (GARP) region in the N-terminal tail (Top panel). CNGB1 interacts with the C-terminus of the CNGA1 subunit through a region containing the calcium (Ca2+)/calmodulin (CaM) binding site. Cyclic nucleotide-binding domain, CNBD is located in the C-terminal tail. The previously reported disease-causing mutations are in black lettering. The previously reported splice-site mutations are aligned with the CNGB1 exons (Bottom panel). Red lettered are variants detected in our cohort. Stars represent novel variants (modified from mutagenetix website-database of mutations and phenotypes)
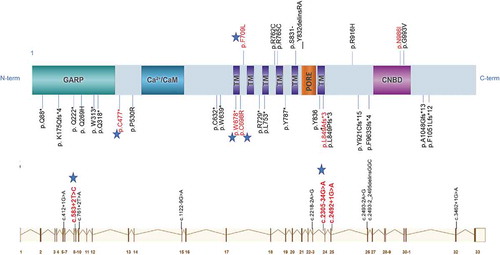
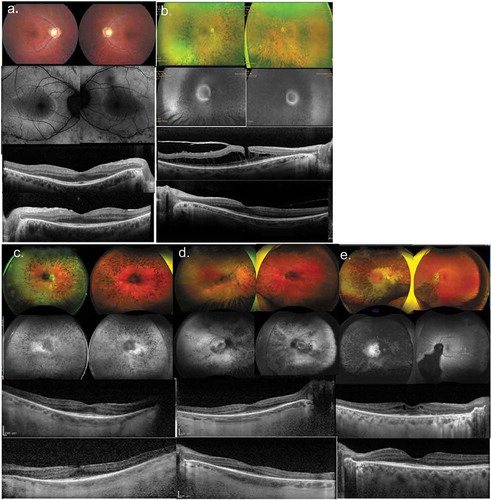
Figure 3. Color fundus images (left panel), SD-OCT horizontal line scans through the fovea (middle panel), and kinetic visual fields (right panel) for families A-E. (a) Patient A1; (b) Patient B3. (c) Patient C1 had cystoid macular edema (arrow) noted on SD-OCT. (d) Patient D1. (e) Patient E1. SD-OCT image on same eye as the kinetic visual field. Right eye, RE; Left eye, LE; blue isopter, spot size V4e; red isopter, spot size III4e; green isopter, spot size I4e

Figure 4. Spectrum of disease severity in patients with CNGB1-associated RP. Color fundus imaging (top row), fundus autofluorescence (2nd row) and right and left eye SD-OCT (bottom 2 rows) images, respectively for patient B1 (a) from family 2; patient F1 (b) from family 6; patients G1 (c) and G2 (d) from family 7; and (e) patient H1 from family 8, illustrating typical presentations of RP features (b–e) waxy pallor of the optic disc, severe attenuation of the retinal vasculature, RPE breakdown, and bone-spicule pigment clumping in the mid-periphery. (b and e) Cystoid macular edema (CME) and (a–c) epiretinal membrane. A macular hole is evident for patient F1 (B)