Figures & data
Figure 1. Clinical evaluation and genetic test for the DOA patient. (a) The color fundus image. Color fundus photographs showed paled temporal optic disc in both eyes of the patient, and normal optic disc in both eyes of the normal control. R: right eye, L: left eye. (b)Visual field test in both eyes of the patient. (c)Optical coherence tomography of the right (R) and left (L) eyes around optic disc for patient. (d) The novel heterozygous variant, c.1444–2A>C in the DOA patient, confirmed by Sanger sequencing. PII, DOA patient; I-2, mother, as a family control. “+”, wild-type allele; “-”, mutant allele
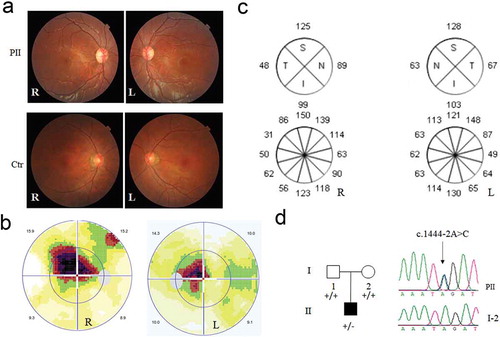
Figure 2. Effects of the splicing variant on OPA1 mRNA-transcript and its translation. The cDNA segments by reverse transcription polymerase chain reaction analyzed with the agarose gel (a), and Sanger sequencing (b). RNA extracted from the patient (PII) and other two controls (Ctr1, mother as a family control; Ctr2, genetically unrelated control subject with the same mtDNA haplotype). A schematic diagram below shows the Exon 15 skipping, caused by c.1444–2A>C. (c) The mRNA expression by three pairs of primers. segment by Primer1 encompass the exon15; segment by Primer2 is downstream the exon 15; segment by Primer3 is upstream the exon15. 50% reduction of mRNA expression was checked in the mutant cell, related to the controls. (d) Western blotting of OPA1 protein in the mutant and control cells. OPA1 protein decreased 50% in the mutant cells as comparison to the control. *, P < .05; **, P < .01; ***, P < .001
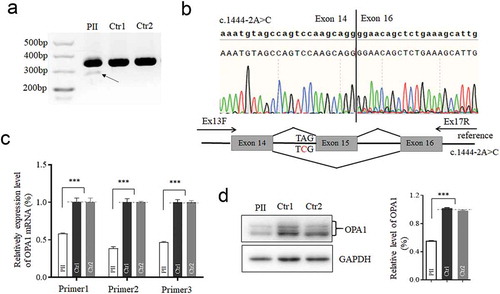
Figure 3. Assay for Mitochondrial DNA content, mitochondrial mass and its morphology. (a) Measurements of mtDNA copy numbers in lymphoblastoid cell lines. The mtDNA copy numbers were determined as a ratio of mtDNA to nDNA (18S) by real-time quantitative PCR (n = 11 or 12). (b) Mitochondrial mass visualized by Immunofluorescent labeling. TOM20 (red) stained for mitochondria; DAPI stained for nuclei. (c)Mitochondrial morphology, imaged by TEM. Punctate and tubular mitochondria mixed in cells. (d) Western blotting of mitochondrial fusion (MFN1 and MFN2) and fission (DRP1) protein, GAPDH as a loading control. *, P < .05; **, P < .01; ***, P < .001. ns, non-significantly
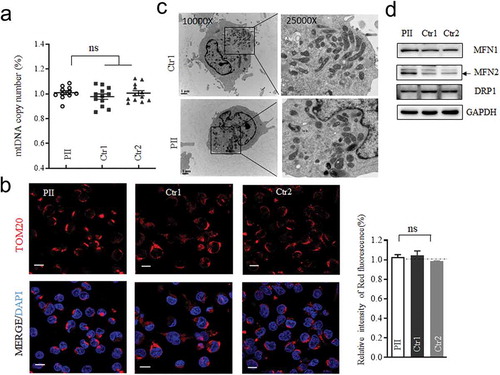
Figure 4. Mitochondrial function analysis. (a) The rates of oxygen consumption (OCR) in the various cell lines using different inhibitors. OCR were first measured on 1 × 10⁵ cells of each cell line under basal conditions and then after the addition of oligomycin (1 μM), carbonyl cyanide p-(trifluoromethoxy) phenylhydrazone (FCCP) (0.5 μM), rotenone (1 μM) and antimycin A (1 μM) to determine different parameters of mitochondrial functions. Graphs presented the basal OCR, ATP-linked OCR, and the maximal OCR in cell lines. (b)Measurement of cellular and mitochondrial ATP levels using bioluminescence assay. Cells were incubated with 10 mM glucose or 5 mM 2-deoxy-D-glucose plus 5 mM pyruvate to determine ATP generation under cellular and mitochondrial ATP levels. Data are mean ± SD of quadruplication. (c) Measurement of mitochondrial ROS by BD-LSR II flow cytometer system using Mitochondrial Superoxide Indicator, MitoSOX Red. Data are mean ±SD of triplicates. *, P < .05; **, P < .01; ***, P < .001. ns, non-significantly
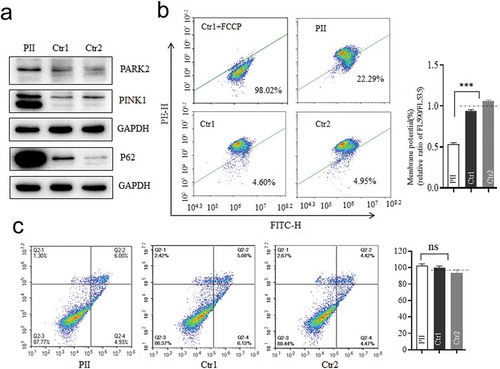
Figure 5. Mitophagy and apoptosis assay. (a) Western blotting analysis using antibodies for Parkin (PARK2), PINK1, and P62 with GAPDH as a loading control. (b)Mitochondrial membrane potential (MMP) measured by the fluorescence probe JC-10 assay. The ratio of fluorescence intensities Ex/Em = 490/590 nm and 490/530 nm (FL590/FL530) were recorded to delineate the MMP level of each sample. Data are mean ±SD of triplicates. (c) The apoptosis evaluation using the Annexin V-FITC/PI apoptosis detection kit by flow cytometry. Data are mean ±SD of triplicates. *, P < .05; **, P < .01; ***, P < .001. ns, non-significantly