
Figures & data
Table 1. Phenotypic features of OAS patients.
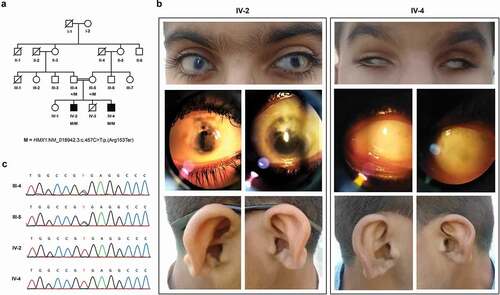
Figure 1. Family structure, clinical and molecular findings: (a) Pedigree showing segregation of the nonsense mutation (M) p(Arg153Ter) in the HMX1 gene. White and black shapes denote healthy and affected individuals, respectively; squares, males; circles, females; symbols with a diagonal line, deceased; double horizontal lines, consanguineous union. (b) Photographs of eyes and ears of the individuals examined (IV-2 and IV-4). (c) Chromatograms showing segregation of p(Arg153Ter) within the family.
Supplemental material