
Figures & data
Figure 1. Flowchart depicting an outline of the participant inclusion process from the Trønderbrain and DDI cohorts and workflow of the paper.
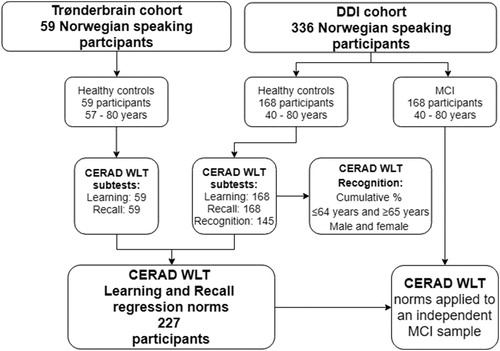
Table 1. Cumulative percentiles for the CERAD WLT recognition subtest.
Table 3. Normative regression models for CERAD WLT Learning and Recall subtests.
Table 4. Demographics, raw scores and T scores of the healthy controls and MCI group.
Table 2. Raw score to scaled score conversions.
Supplemental material
TCN-OA_18-207-File003.html
Download HTML (6.3 KB)Data availability statement
The data that support the findings of this study are available on request from the corresponding author, B-E.K. The data are not publicly available due to restrictions e.g. their containing information that could compromise the privacy of research participants.