
Figures & data
Table 1. Demographic and clinic data.
Figure 1. The figure displays apraxia profiles. It includes the profile description for the respective patient groups (LHS = stroke in the left hemisphere, n = 44; RHS = stroke in the right hemisphere, n = 36; TBI = traumatic brain injury, n = 44; MS = multiple sclerosis, n = 26; Dem = dementia, n = 27) for the average performance across subscales per subtest of the DILA-S (IML = imitation of meaningless gestures; IMF = imitation of meaningful gestures; PTU = pantomime; NTT = novel tools test; FTT = familiar tools test; NAT = naturalistic action test - breakfast task). For pantomime of tool-use the execution scale is shown. For novel and familiar tools test, the mean performance of selection and execution subscales is shown.
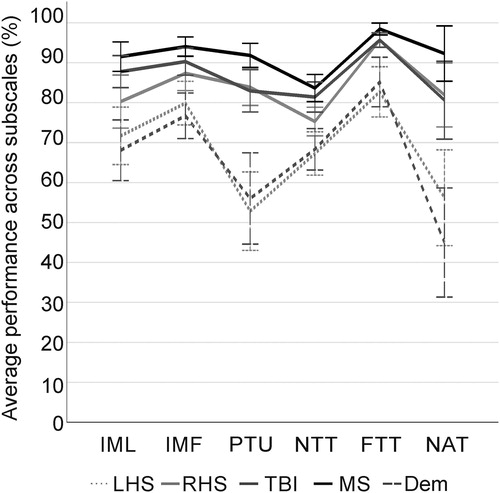
Figure 2. The figure displays performance in the imitation of meaningless (left graph) and meaningful (middle graph) gestures and pantomime of tool-use (right graph). It includes the distribution of apraxia severity (no, mild, moderate and severe apraxia) in percent per group for the distinct patient groups (patients with stroke in the left hemisphere [LHS, n = 44], stroke in the right hemisphere [RHS, n = 36], traumatic brain injury [TBI, n = 44], multiple sclerosis [MS, n = 26], dementia [Dem, n = 27]) in the subscales imitation of meaningless gestures (left), imitation of meaningful gestures (middle) and pantomime of tool-use (right). Significant group differences are marked with stars: **p ≤ .010, *p ≤ .050.
![Figure 2. The figure displays performance in the imitation of meaningless (left graph) and meaningful (middle graph) gestures and pantomime of tool-use (right graph). It includes the distribution of apraxia severity (no, mild, moderate and severe apraxia) in percent per group for the distinct patient groups (patients with stroke in the left hemisphere [LHS, n = 44], stroke in the right hemisphere [RHS, n = 36], traumatic brain injury [TBI, n = 44], multiple sclerosis [MS, n = 26], dementia [Dem, n = 27]) in the subscales imitation of meaningless gestures (left), imitation of meaningful gestures (middle) and pantomime of tool-use (right). Significant group differences are marked with stars: **p ≤ .010, *p ≤ .050.](/cms/asset/bdbe7a95-820d-4b87-9190-6afd02b82632/ntcn_a_1585575_f0002_b.jpg)
Figure 3. The figure displays the distribution of apraxia severity (no, mild, moderate, and severe apraxia) in the novel (left) and familiar tools (right) tests. The subscales selection (above) and execution (below) are shown for both tests. Apraxia severity is shown in percent per group for the distinct patient groups (patients with stroke in the left hemisphere [LHS, n = 44], stroke in the right hemisphere [RHS, n = 36], traumatic brain injury [TBI, n = 44], multiple sclerosis [MS, n = 26], dementia [Dem, n = 27]). Significant group differences are marked with stars: **p ≤ .010, *p ≤ .050.
![Figure 3. The figure displays the distribution of apraxia severity (no, mild, moderate, and severe apraxia) in the novel (left) and familiar tools (right) tests. The subscales selection (above) and execution (below) are shown for both tests. Apraxia severity is shown in percent per group for the distinct patient groups (patients with stroke in the left hemisphere [LHS, n = 44], stroke in the right hemisphere [RHS, n = 36], traumatic brain injury [TBI, n = 44], multiple sclerosis [MS, n = 26], dementia [Dem, n = 27]). Significant group differences are marked with stars: **p ≤ .010, *p ≤ .050.](/cms/asset/8158bbc9-94c4-4f09-bad5-9ba6ed71c030/ntcn_a_1585575_f0003_b.jpg)
Figure 4. The distribution of apraxia severity (no, mild, moderate, and severe apraxia) in the naturalistic action test - breakfast task is presented. Apraxia severity is shown in percent per group for the distinct patient groups (patients with stroke in the left hemisphere [LHS, n = 44], stroke in the right hemisphere [RHS, n = 36], traumatic brain injury [TBI, n = 44], multiple sclerosis [MS, n = 26], dementia [Dem, n = 27]). Significant group differences are marked with stars: **p ≤ .010, *p ≤ .050.
![Figure 4. The distribution of apraxia severity (no, mild, moderate, and severe apraxia) in the naturalistic action test - breakfast task is presented. Apraxia severity is shown in percent per group for the distinct patient groups (patients with stroke in the left hemisphere [LHS, n = 44], stroke in the right hemisphere [RHS, n = 36], traumatic brain injury [TBI, n = 44], multiple sclerosis [MS, n = 26], dementia [Dem, n = 27]). Significant group differences are marked with stars: **p ≤ .010, *p ≤ .050.](/cms/asset/f05c10b0-9e1d-4691-87d3-b79ead8a7830/ntcn_a_1585575_f0004_b.jpg)
Figure 5. The average performance on production parameters in pantomime of tool-use (left), novel (middle) and familiar tools test (right) is presented. Mean percentage scores of performance in grip-formation, orientation of thumb, movement-content, orientation of movement and body-part-as-object-errors are shown for the distinct patient groups (patients with stroke in the left hemisphere [LHS, n = 44], stroke in the right hemisphere [RHS, n = 36], traumatic brain injury [TBI, n = 44], multiple sclerosis [MS, n = 26], dementia [Dem, n = 27]).
![Figure 5. The average performance on production parameters in pantomime of tool-use (left), novel (middle) and familiar tools test (right) is presented. Mean percentage scores of performance in grip-formation, orientation of thumb, movement-content, orientation of movement and body-part-as-object-errors are shown for the distinct patient groups (patients with stroke in the left hemisphere [LHS, n = 44], stroke in the right hemisphere [RHS, n = 36], traumatic brain injury [TBI, n = 44], multiple sclerosis [MS, n = 26], dementia [Dem, n = 27]).](/cms/asset/21130249-2195-4eab-b0da-7112e87d7ea7/ntcn_a_1585575_f0005_b.jpg)