
Figures & data
Figure 1. An open-ended (Panel A) and a multiple-choice (Panel B) item of the MESSY.
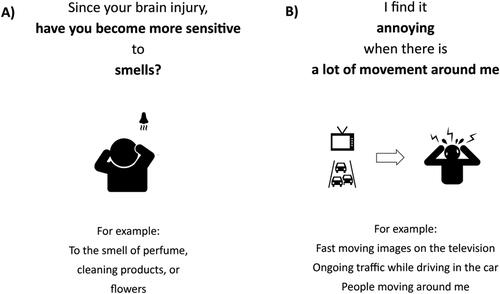
Figure 2. Respondent flow diagram. ADHD = Attention Deficit Hyperactivity Disorder. ASD = Autism Spectrum Disorder.
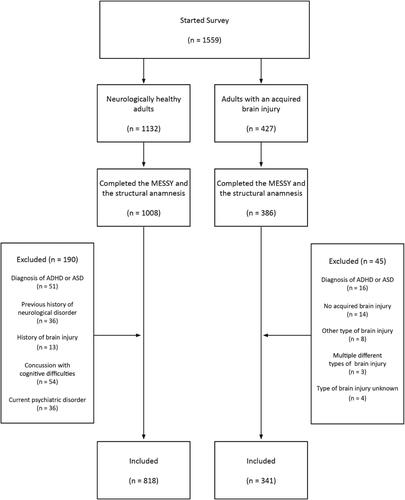
Table 1. Characteristics of all included respondents.
Table 2. Characteristics of included acquired brain injury patients per type of injury.
Table 3. Internal consistency of the MESSY in neurotypical adults and acquired brain injury patients.
Table 4. Goodness-of-fit indicators for the different factor models.
Table 5. Standardized factor loadings of the seven-factor model in neurotypical adults and acquired brain injury patients.
Table 6. Summary of the measurement invariance analysis.
Table 7. The reliability and validity of the MESSY.
Figure 3. Observed and predicted total MESSY score based on age (in years) stratified according to gender in 818 neurotypical adults. A higher MESSY score represents a higher severity of sensory hypersensitivity.
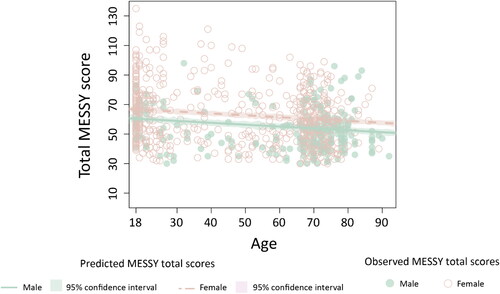
Table 8. Multiple regression for the total score on the MESSY in neurotypical adults (n = 818).
Table 9. Normative data for the MESSY based on data in neurotypical adults (aged 18-96, n = 818).
Table 10. The percentage of acquired brain injury patients with post-injury sensory hypersensitivity per sensory modality and per type of brain injury.
Table 11. Results of the Quade’s ANCOVA (n = 1159).
Figure 4. The distribution of the total score on the MESSY for neurotypical adults, for acquired brain injury patients without post-injury sensory hypersensitivity (ABI without SH), and stroke, traumatic brain injury (TBI), and brain tumour patients with post-injury sensory hypersensitivity (with SH).
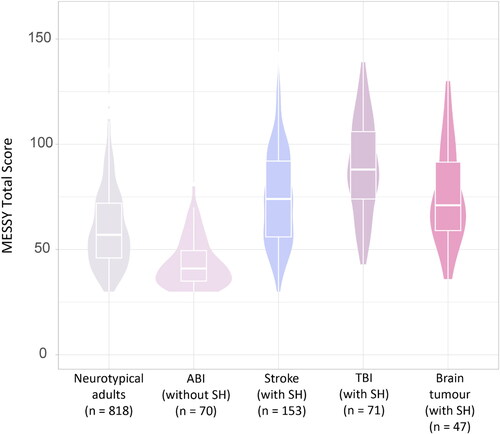
Figure 5. The distribution of the mean item scores per modality on the MESSY for neurotypical adults, for acquired brain injury patients without post-injury sensory hypersensitivity (ABI SH-) and stroke, traumatic brain injury (TBI), and brain tumour patients with post-injury sensory hypersensitivity (SH+).
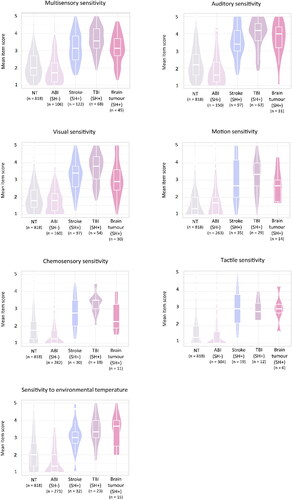
Table 12. The adjusted pvalue of the pairwise Dunn tests per sensory modality.
Table 13. Results of the Wilcoxon rank-sum test comparing the sensory sensitivity between patients with sensory hypersensitivity after a mild traumatic brain injury and patients with sensory hypersensitivity after a moderate to severe traumatic brain injury.
Supplemental Material
Download MS Word (30.5 KB)Data availability statement
The datasets analyzed during the current study are available upon request from the corresponding author (CRG) or are openly available at https://doi.org/10.6084/m9.figshare.21840504.