Figures & data
Figure 1. Outlet concentration in species A and B versus time.
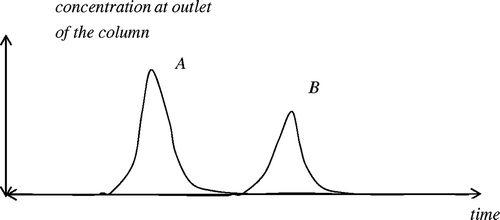
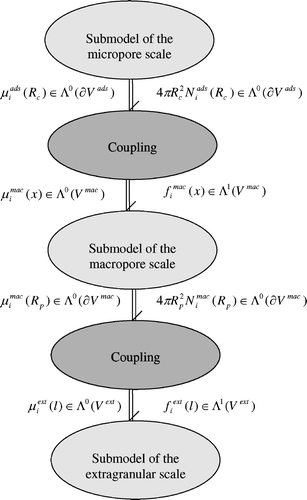
Figure 2. Description of the different scales of the adsorption column.
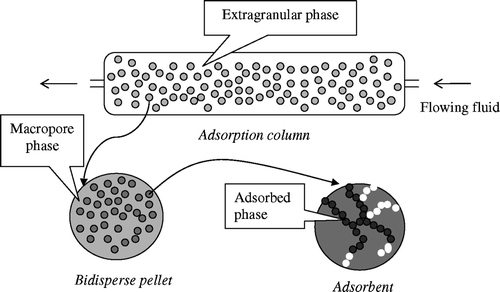
Figure 3. Bond Graph representation of the Stoke – Dirac structure.
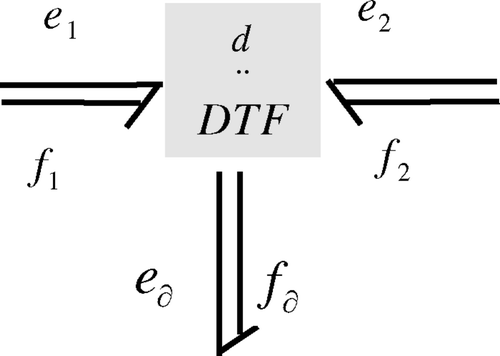
Figure 4. Bond Graph representation of the mass transfer submodel.
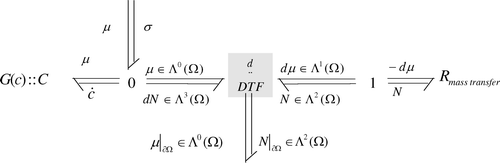
Figure 5. Bond Graph representation of the adsorption process at the microporous scale.
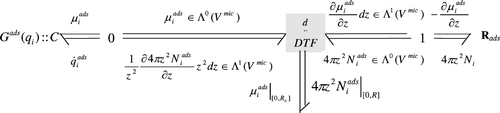
Figure 6. Bond Graph model of the diffusion at the macroporous scale.
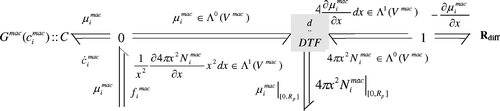
Figure 7. Bond Graph model in the Extragranular scale.
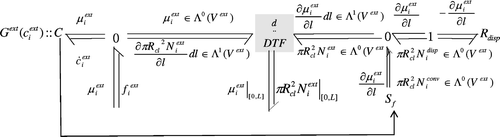
Figure 8. Complete bond graph of the adsorption column.