Figures & data
Figure 1. Series hybrid power train block diagram.
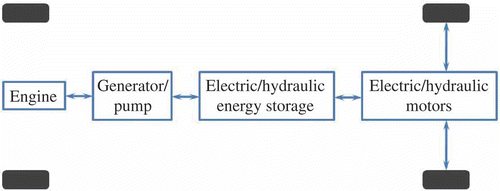
Figure 2. Main modules included in the model.
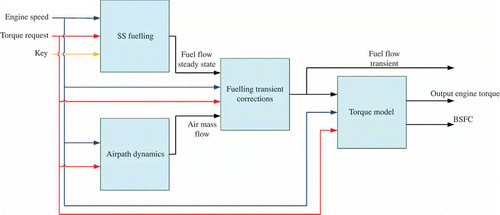
Figure 3. Results of the airpath model prediction with optimized time constant for torque tip-in.
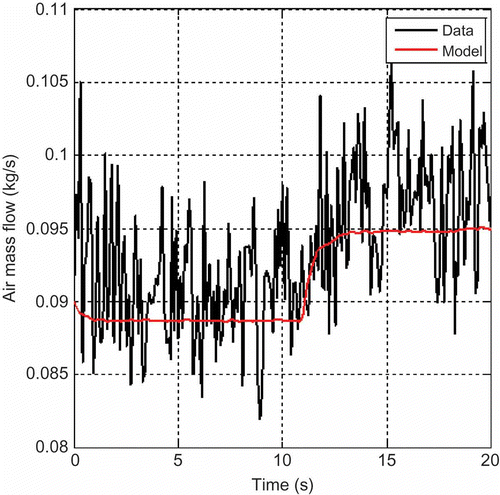
Figure 4. Results of the airpath model prediction with optimized time constant for torque tip-out.
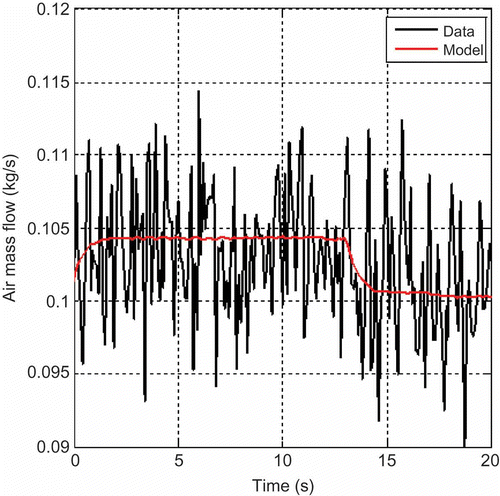
Figure 5. A typical experimental fuelling start-up trace.
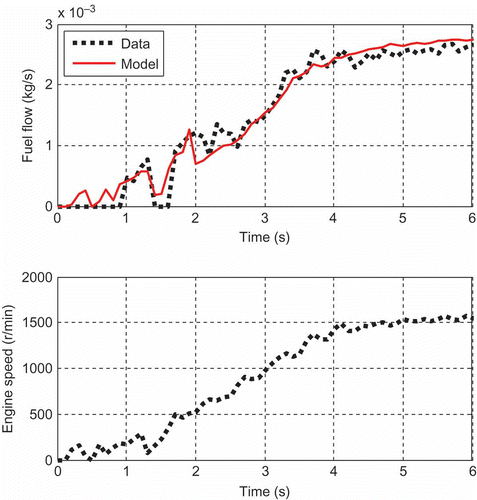
Figure 6. Comparisons between model predicted fuel mass flow with the experimental data during four start-up events.
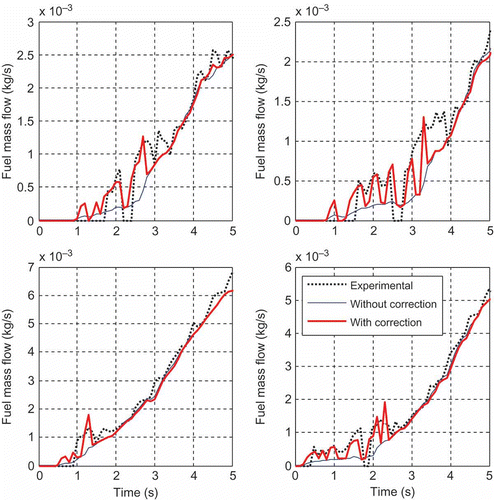
Figure 7. Start-up cumulated fuel predicted by the model (with and without correction) compared with the experimental data.
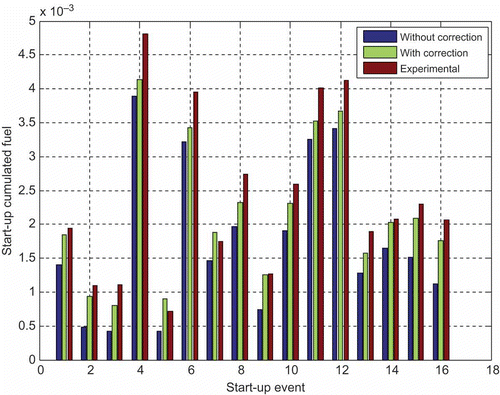
Figure 8. Torque module structure.
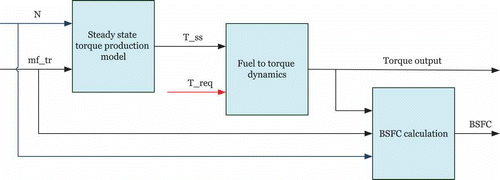
Figure 9. Comparison between the model prediction of the brake torque with and without implementation of the torque dynamics module as compared with the experimental data.
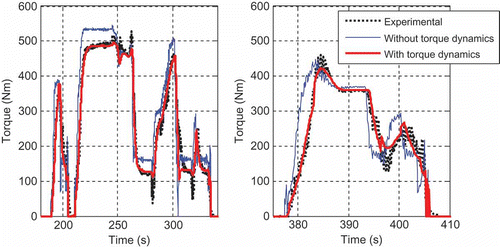
Figure 10. The experimental engine setup.
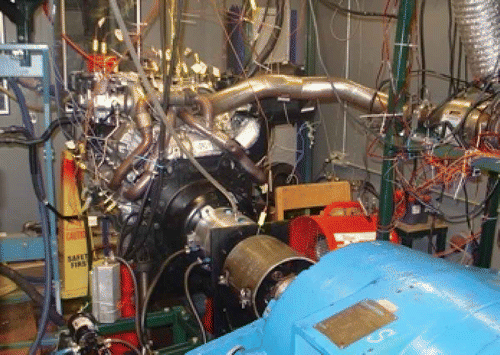
Figure 11. Engine speed and torque request of a pseudo-FTP-72 driving cycle for model validation.
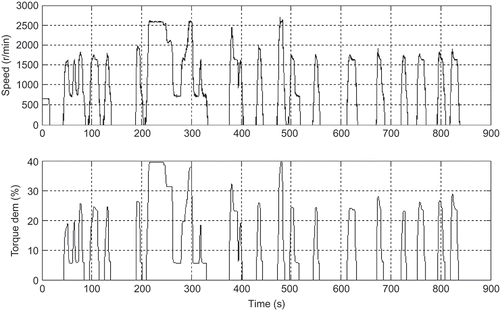
Figure 12. Comparison of fuel flow and brake torque from model and from experimental data.
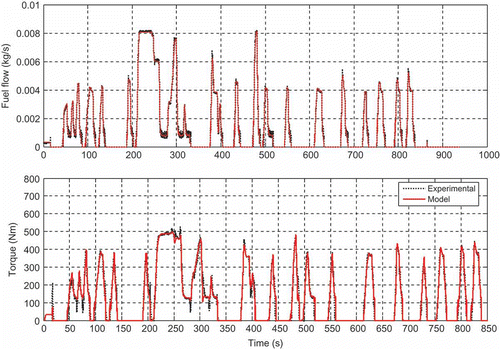
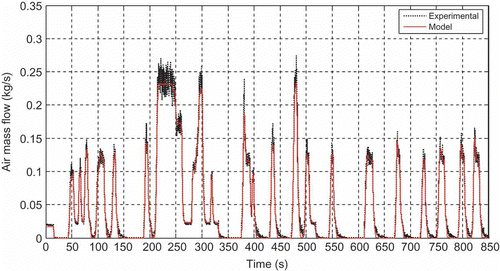
Figure 13. Comparison of air mass flow rate from model and experimental data.