Figures & data
Table
Figure 1. Pictorial representation of two-warehouse inventory system with SFI policy.
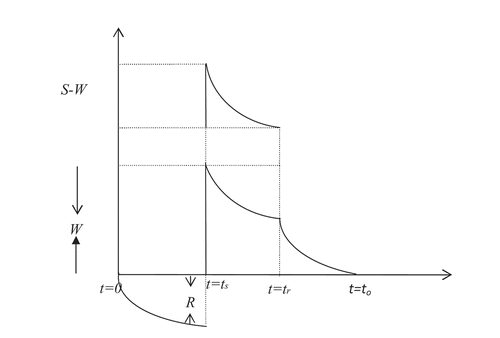
Table 1. Best found solution of the model with IFS policy by PSO-CO.
Table 2. Best found solution of the model with IFS policy by GQPSO.
Table 3. Best found solution of the model with IFS policy by WQPSO.
Table 4. Best found solution of the model with SFI policy by PSO-CO.
Table 5. Best found solution of the model with SFI policy by GQPSO.
Table 6. Best found solution of the model with SFI policy by WQPSO.
Table 7. Statistical analysis of the results obtained for different demand and backlogging rates in SFI by PSO-CO.
Table 8. Statistical analysis of the results obtained for different demand and backlogging rates in SFI by GQPSO.
Table 9. Statistical analysis of the results obtained for different demand and backlogging rates in SFI by WQPSO.
Figure 2. Percentage changes in centre value of average cost w.r.t W, b, and r.
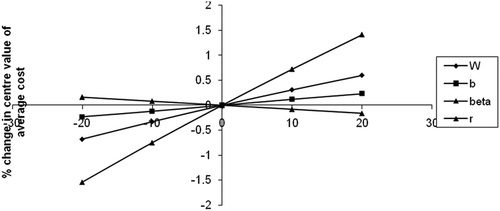
Figure 3. Percentage changes in centre value of average cost w.r.t a and .
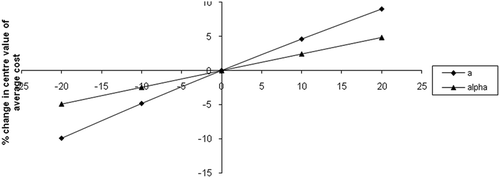
Figure 4. Percentage changes in S w.r.t W, b, and r.
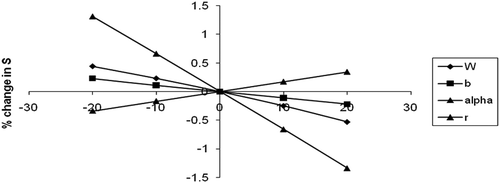
Figure 5. Percentage changes in S w.r.t a and .
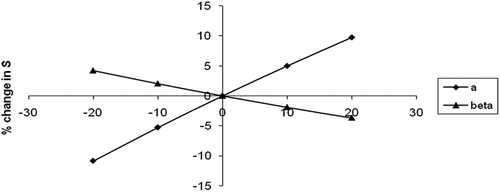
Figure 6. Percentage changes in R w.r.t W, b, and r.
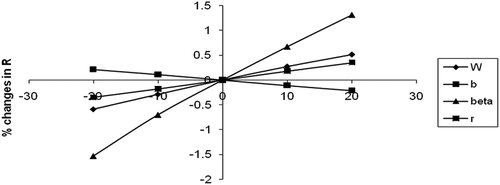
Figure 7. Percentage changes in R w.r.t a and .
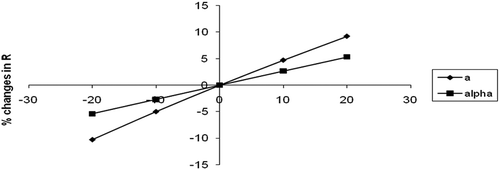
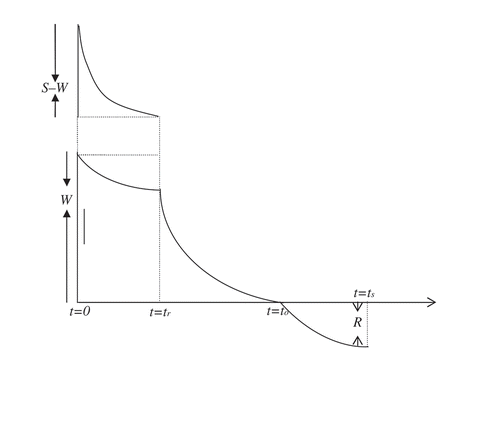
Figure A.1. Pictorial representation of two-warehouse inventory system with IFS policy.