Figures & data
Figure 1. Convex cones (left),
(right) and
.
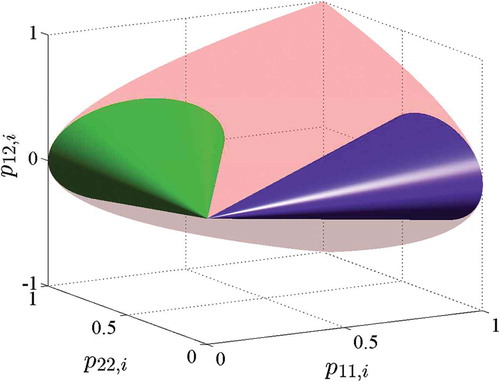
Table 1. Comparison of the adjusted ROBs and of the respective minimum values of the objective functions for matrix interpolation with and without STABLE.
Figure 2. Convex cones (top left),
(bottom right) in the plane
and optimal
with minimum cost function
.
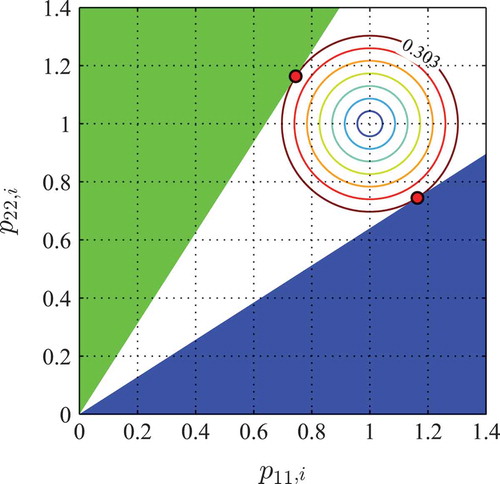
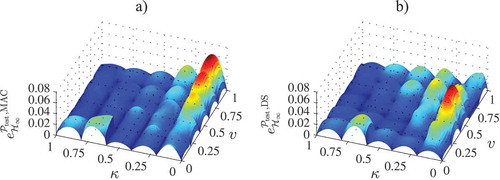
Figure 3. Error without the stability-preserving method and the (a) MAC approach and the (b) DS approach.
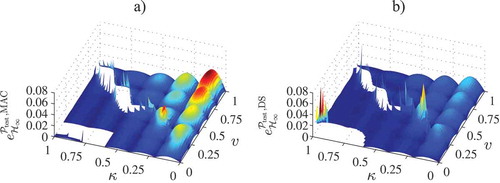
Figure 4. Error using STABLE and the (a) MAC approach and (b) DS approach.