Figures & data
Figure 1. Illustration of a self-regulating pneumatic valve.
Figure 2. Modelica symbol layer of the valve model.
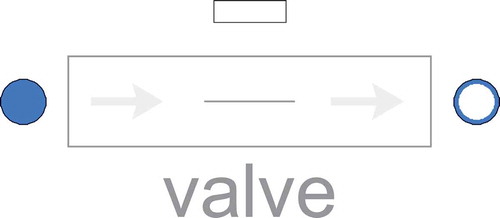
Figure 3. Illustration of the gas-dynamics connector principle, including information about multiple volume cells.
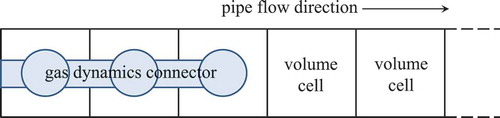
Figure 4. Modelica component layer of the pneumatic valve actuator model.
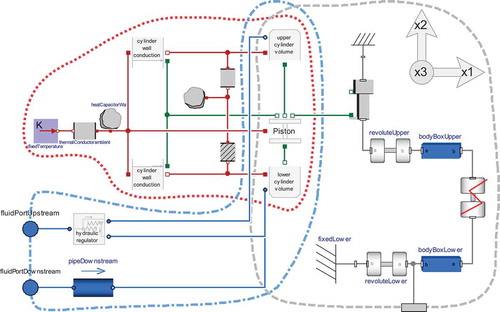
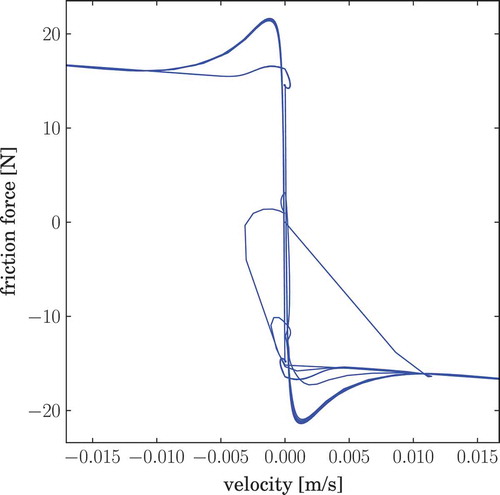
Figure 5. A trajectory (friction force w.r.t. velocity) of the Lund–Grenoble friction model.
1. Listing 1. Extract of Modelica code for lower variable volume model
Figure 6. Thermal structure of the valve actuator.
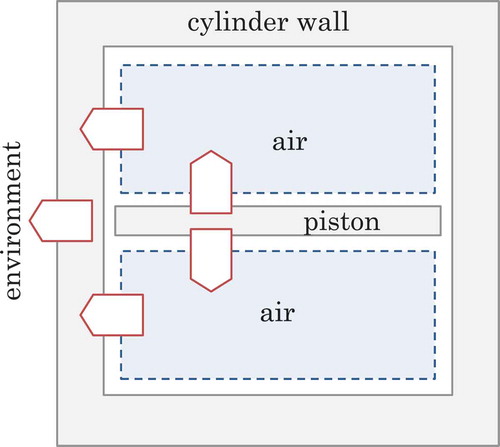
Figure 7. Modelica diagram of oscillation test case.
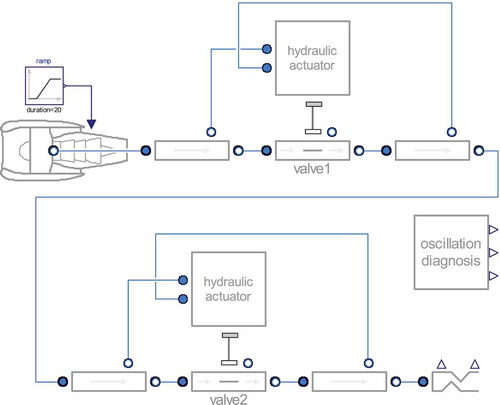
Figure 8. Results of oscillation test case.
Figure 9. Amplitude and period of oscillations for scaled friction forces and cylinder volumes.
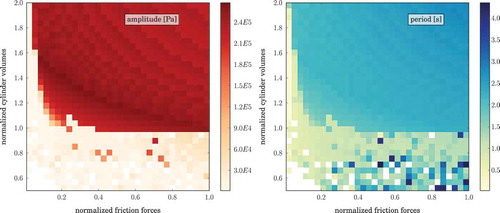
Figure 10. Control system development strategy.
Figure 11. Sensitivities of solver parameters.
Figure 12. Sensitivities of friction parameters (reference values are marked).
Figure 13. Sensitivity of aerodynamic forces.
Figure 14. Deviations in the aerodynamic torque as a function of the valve angle.
Figure 15. Sensitivity of the parameter scaleaero on aerodynamic forces.
Figure 16. Sensitivity of mass flow characteristic.
Figure 17. Aerodynamic torque test model.
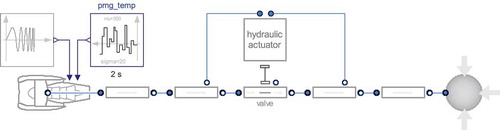
Figure 18. Transient effects of aerodynamic torque.
Figure 19. Transient effects of oscillatory heating.