Figures & data
Figure 1. State space simulation of an aircraft’s rudder control and actuation system.
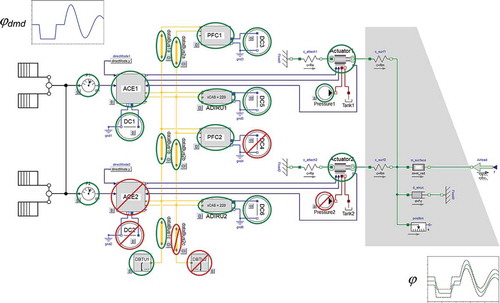
Figure 2. An electric voltage source (a), a voltage divider resistor (b) and a ground (c).
Figure 3. Simulation of a flight control surface deflection angle . System operates = sysOp for
. System failure = not sysOp for
,
.
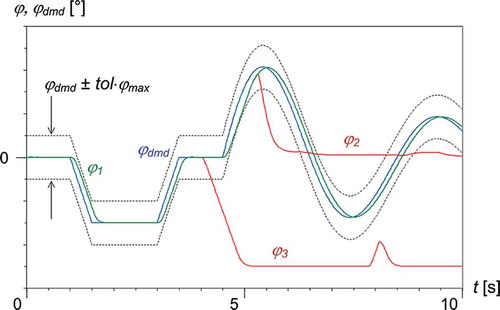
Figure 4. Exchange of power and signals across the edges in a coherent set of nodes.
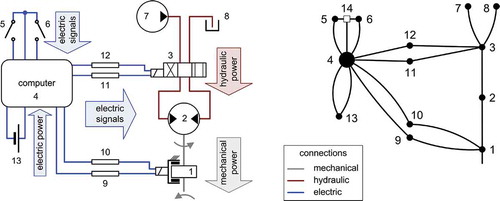
Figure 5. Coherent (a), (b), (c) and incoherent sets of nodes (d), (e) in a graph.
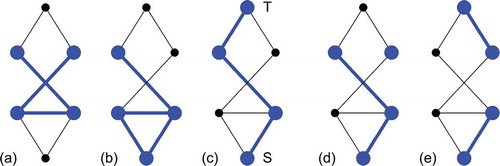
Figure 6. Components and connections in a multi-domain object-oriented model.
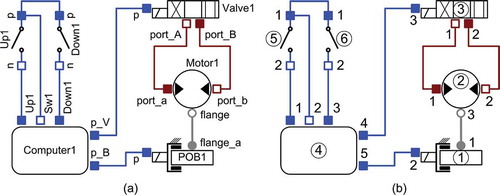
Figure 7. Adjacency list AL and graph for Figure 6(b) .
Figure 8. Flow chart of minimal path set detection algorithm DMP.
Figure 9. Redundant electric heating circuit.
Figure 10. Graph (a) of electric heating circuit shown in Figure 9 and its three minimal paths (b), (c), (d) .
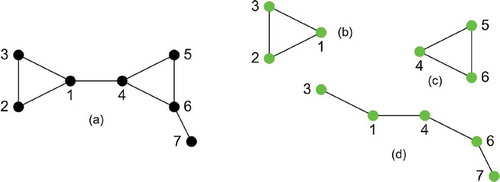
Table 1. Combinations tested (by simulation of system model) at initial stage of detection process.
Table 2. Path set after initial stage of detection process.
Table 3. Combinations tested during first iteration of detection process.
Figure 11. Combinations tested during first iteration of detection process.
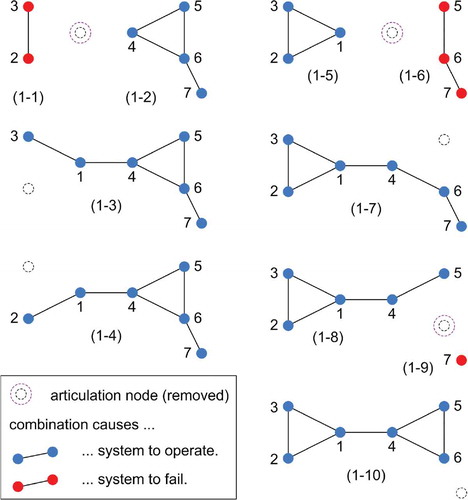
Table 4. Combinations tested during first iteration that remove two non-articulations from PSprev[1,:].
Figure 12. Combinations tested during first iteration that remove two non-articulations from PSprev[1,:].
![Figure 12. Combinations tested during first iteration that remove two non-articulations from PSprev[1,:].](/cms/asset/97879724-21bb-4a86-ac10-fc8dd947c1ef/nmcm_a_1298624_f0012_oc.jpg)
Table 5. Path set PS and combinations that cause system failure SF, as existent after first iteration of detection process.
Figure 13. Path set PS and combinations that cause system failure SF, as existent after first iteration of detection process.
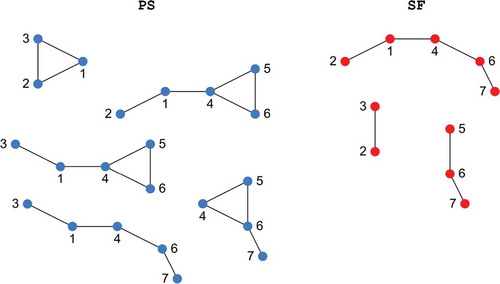
Table 6. Combinations tested during second iteration of detection process.
Table 7. Path set PS and combinations that cause system failure SF, as existent after second iteration of detection process.
Figure 14. Path set PS and combinations that cause system failure SF, as existent after second iteration of detection process.
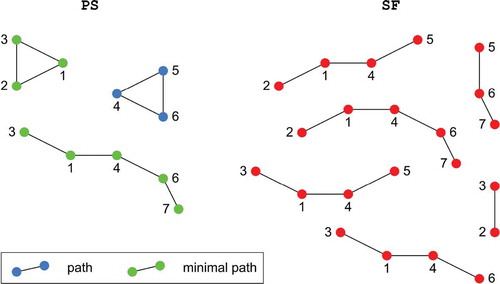
Table 8. Third iteration of detection process (no combinations tested).
Table 9. Minimal path set detected after third iteration of the process.
Table 10. Comparison of effort of minimal path set detection for three cases.
Figure 15. An example system graph, higher density than that of Figure 10(a).