Figures & data
Figure 1. Sketch of the conceptional model. Based on the coach’s view on the exercise, we structure the temporal domain into meaningful phases. Phase transitions are the crucial moments of the exercise, and are therefore described by measurements based on the position data. Using unsupervised clustering techniques, different behavioural patterns are extracted and related to performance indicators.
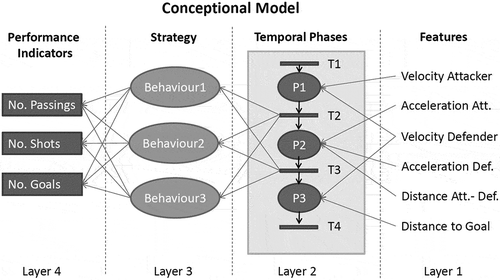
Table 1. Summary of the description of the one-versus-one exercise. See [Citation28] for the full study design.
Table
Table
Figure 2. The disagreement in the transition moment prediction between the two sports experts (E1–E2) and the disagreement between our detection algorithm with the first expert (E1–NN) and second expert (E2–NN). Left plot shows results for t2, right plot for t3, respectively.
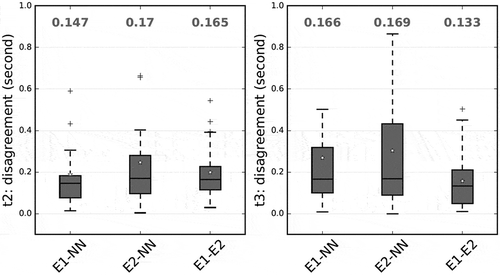
Figure 3. Spectral clustering result with performance indicators for three identified behavioural patterns (left) and the derived linguistic description based on four manually selected features (right).
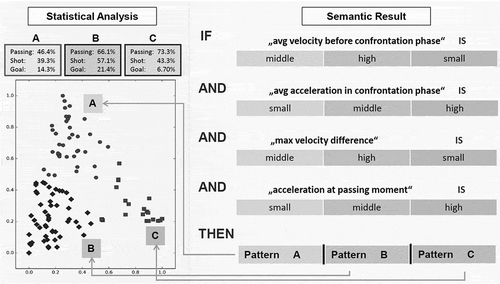
Table 2. Summary of the player assessment.
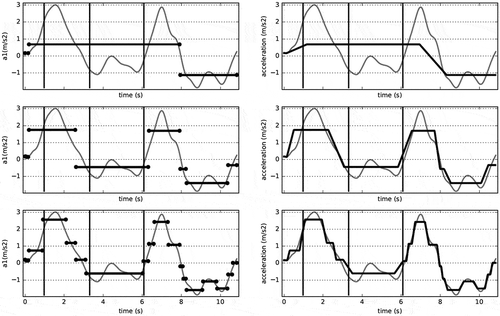
Figure A1. Illustration of the signal decomposition based on discrepancy norm, which yields a coarse-to-fine approximation due to the chosen level of the generated tree of nested intervals. That three vertical solid lines indicate the transition moments t1, t2 and t3 (from left to right).