Figures & data
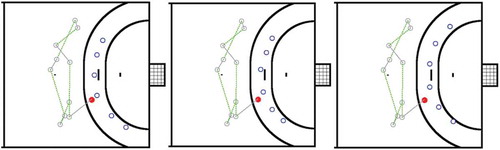
Figure 1. Schematic display of the ball path during the last five passes prior to the shot [P: pass; S: shot; solid line: running path; dashed line: passing path].
![Figure 1. Schematic display of the ball path during the last five passes prior to the shot [P: pass; S: shot; solid line: running path; dashed line: passing path].](/cms/asset/56e4f539-eeaa-42d9-9b16-936509e982a4/nmcm_a_1336733_f0001_oc.jpg)
Figure 2. Distance between the shooting player to the nearest defending player (DistShotDef) and distance between the shooting player and the centre of the goal (DistShotGoal).
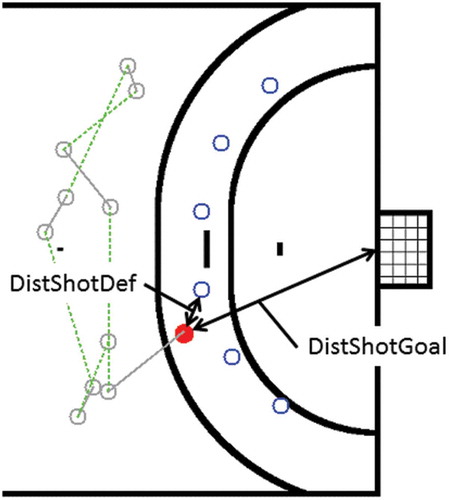
Figure 3. Result of the training process of the artificial neural network for the offensive position data. Clusters are represented by neurons with the same number. Exemplarily, some cluster representations (clusters 1, 2, 6 and 8) displaying the positions of the acting players (open circles, dashed and solid lines represent ball path and running path respectively, and solid circles represent shot position) are shown.
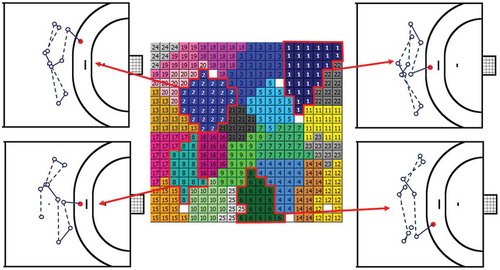
Figure 4. Result of the training process of the artificial neural network for the defensive position data. Clusters are represented by neurons with the same number. Exemplarily, cluster representations (1, 2, 7 and 11) displaying the positions of the defensive players at the instant of the shot are shown.
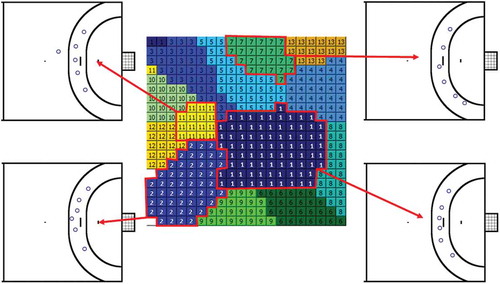
Figure 5. Overview of the frequencies of all cluster combinations. Combinations occurring eight times or more often are shaded in grey.
Table 1. Frequency, goals scored, scoring rate, average distance (±SD) of the shooting player to the nearest defending player (DistanceShotDef) and to the goal (DistanceShotGoal).
Table 2. Odds ratios of the several offensive clusters against different corresponding defensive clusters (A and B).
Figure 6. Offensive pattern #6 against corresponding defensive patterns. Please note that the indicated positions represent offensive and defensive patterns and not actual game situations.