
Figures & data
Figure 1. Cumulated execution times involved in each step of algorithm 1 for different benchmark models ().
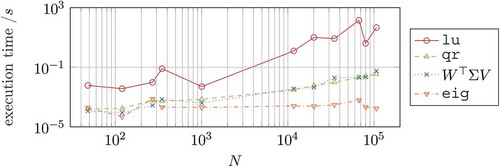
Figure 2. Cumulated execution times as total share of each step of Algorithm 1.
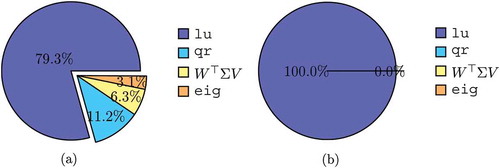
Figure 3. Illustrative Bode plot of and its Model Function
.
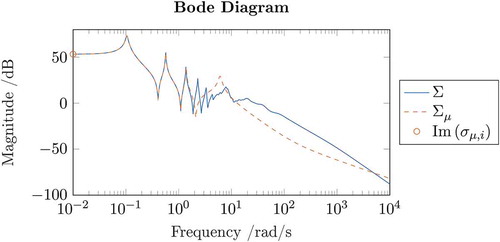
Figure 4. Comparison of ,
and
after
optimization.
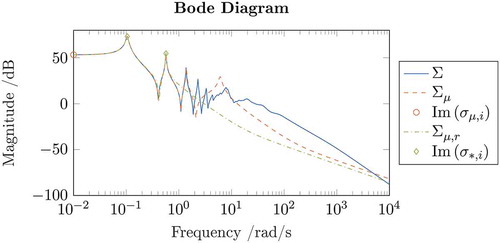
Figure 5. Comparison of ,
and
after repeated
optimization.
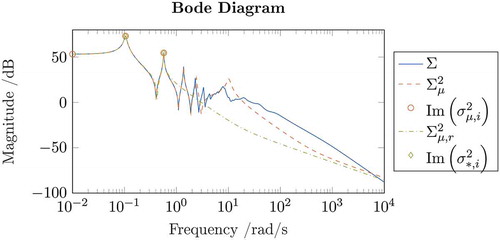
Table 1. Reduction results for the gyro model using zero initialization.
Figure 6. Reduction of the gyro model using CIRKA and IRKA (, 9th output).
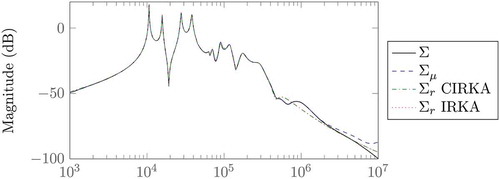
Table 2. Reduction results for the gyro model using eigs initialization.
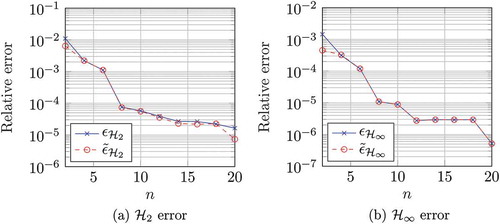
Figure 7. Comparison of relative error and its estimation for the CDplayer model.
Supplemental material