Figures & data
Figure 1. Generic bond graph model for heat transfer through a material separating hot and cold flows. Solid bonds represent hydraulic flow, while dashed bonds represent the flow of thermal energy. Flows are assumed to be incompressible.
Figure 2. Temperature profiles between hot and cold liquid through the wall with two liquid control volumes for a single wall control volume and for three wall control volumes.
Figure 3. Heat exchanger schematics for (a) a shell and tube heat exchanger with baffles, (b) an U-arranged plate heat exchanger.
Figure 4. Thermal bonds for a shell and tube heat exchanger with two pass tube flow, single pass shell flow and two baffles.
Figure 5. Bond graph representation of a U-arranged plate heat exchanger.
Figure 6. Bond graph representation of a pipe.
Figure 7. Heat exchanger bypass flow arrangement with parallel heat exchangers being controlled. Some examples of causality assignments are given in the subfigures, where all assignments results in algebraic loops.
Figure 8. Heat exchanger bypass with bulk modulus C-elements and parallel heat exchangers.
Table 1. Data set for measured STHE used for comparison of steady state model prediction.
Table 2. Comparison between simulation and measured data.
Table 3. Design features difference between the four pass three baffle and two pass six baffle STHE design.
Figure 9. Comparison of two STHE layouts, 4 pass 3 baffles (4P3B) and 2 pass 6 baffles (2P6B), during start up.
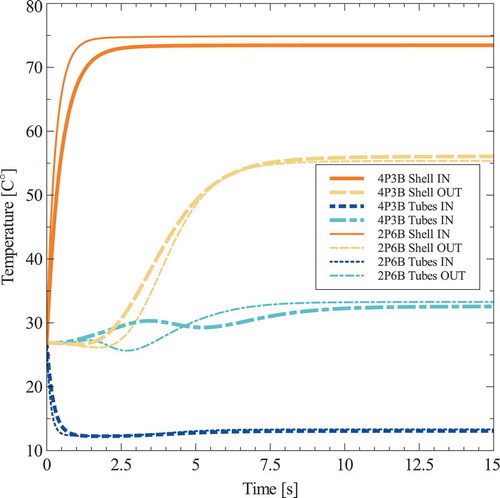
Table 4. Comparison of simulation speeds for a 60 s scenario with different values of the bulk modulus. Simulation time in seconds on a standard laptop computer.
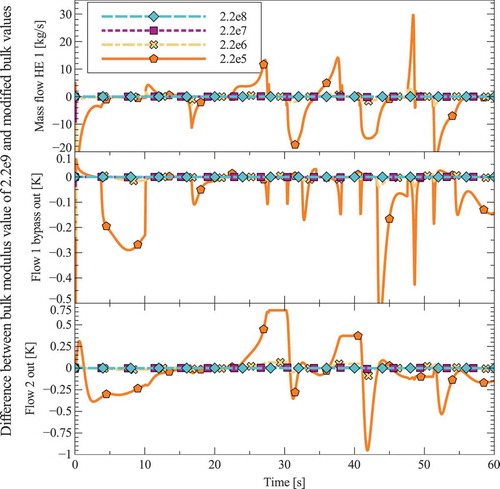
Figure 10. Simulation results for mass flow in hot flow heat exchanger one, the bypass temperature out and the cold flow temperature out. Comparison of the effect of different values of the bulk modulus on the simulation results. Flow 1 is the flow controlled by the bypass valve (hot), while Flow 2 is the uncontrolled flow in the heat exchangers (cold).
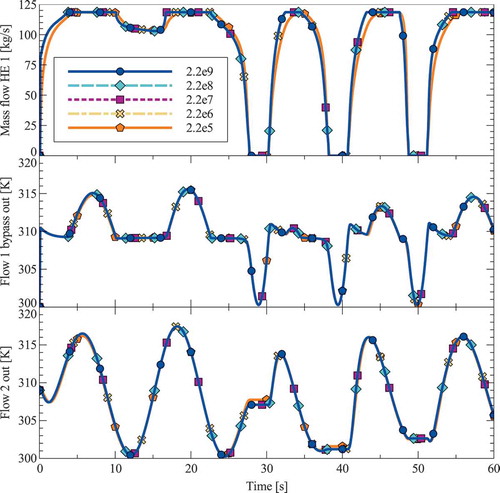
Figure 11. Simulation results for mass flow in hot flow heat exchanger one, the bypass temperature out and the cold flow temperature out. Difference between results when using a bulk modulus of 2.2e9 and modified bulk modulus values.