Figures & data
Figure 1. Basic model for an M/M/1/WV retrial queue with starting failures.
Figure 2. The state transition diagram for an M/M/1/WV retrial queue with starting failures.
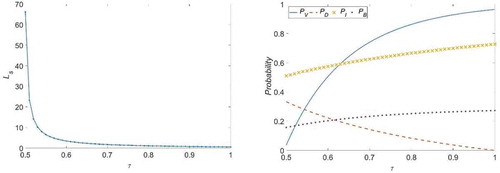
Figure 3. Effect of on
,
,
,
, and
(case 1).
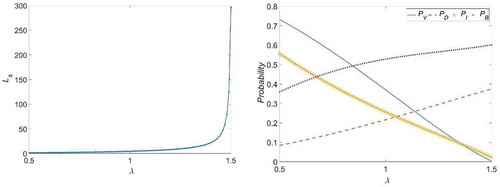
Figure 4. Effect of on
,
,
,
, and
(case 2).
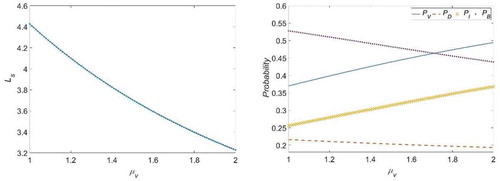
Figure 5. Effect of on
,
,
,
, and
(case 3).
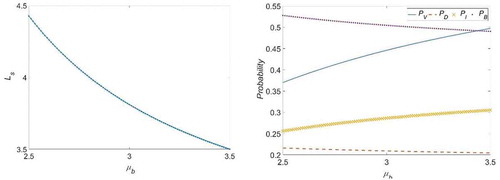
Figure 6. Effect of on
,
,
,
, and
(case 4).
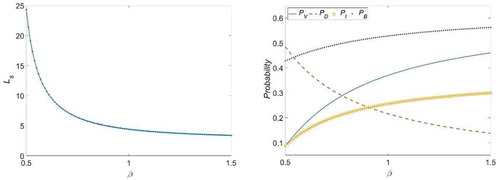
Figure 7. Effect of on
,
,
,
, and
(case 5).
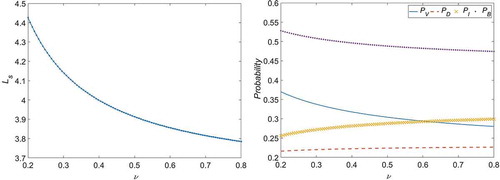
Figure 8. Effect of on
,
,
,
, and
(case 6).
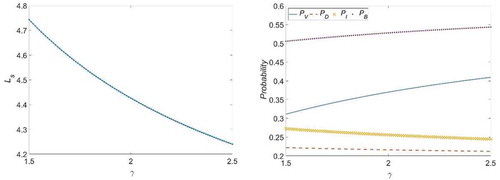
Figure 9. Effect of on
,
,
,
, and
(case 7).
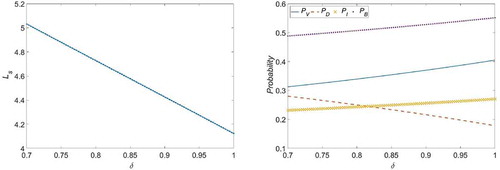
Figure 10. Effect of on
,
,
,
, and
(case 8).
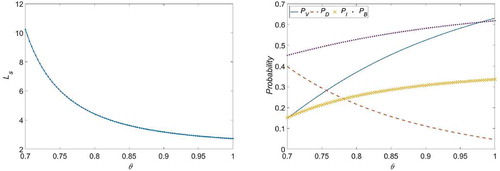
Table 1. Optimal service rates and the corresponding expected cost
for different values of
.
Table 2. Optimal service rates and the corresponding expected cost
for different values of
.
Table 3. Optimal service rates and the corresponding expected cost
for different values of
.
Table 4. Optimal service rates and the corresponding expected cost
for different values of
.
Table 5. Optimal service rates and the corresponding expected cost
for different values of
.
Table 6. Optimal service rates and the corresponding expected cost
for different values of
.
Figure 11. Expected cost for various values of
and
.
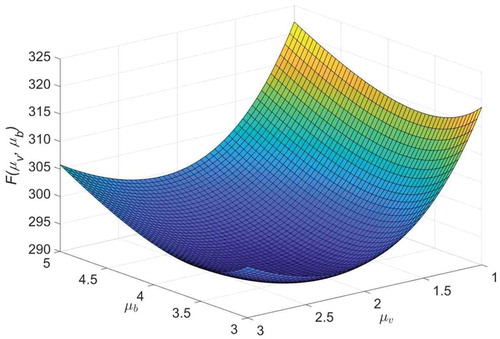
Table 7. Optimal service rates and the corresponding expected cost
for different values of
.
Figure 12. Effect of on
,
,
,
, and
.